Xerox 2009 Annual Report Download - page 38
Download and view the complete annual report
Please find page 38 of the 2009 Xerox annual report below. You can navigate through the pages in the report by either clicking on the pages listed below, or by using the keyword search tool below to find specific information within the annual report.-
 1
1 -
2
-
3
-
4
-
5
-
6
-
7
-
8
-
9
-
10
-
11
-
12
-
13
-
14
-
15
-
16
-
17
-
18
-
19
-
20
-
21
-
22
-
23
-
24
-
25
-
26
-
27
-
 28
28 -
 29
29 -
 30
30 -
 31
31 -
 32
32 -
 33
33 -
 34
34 -
 35
35 -
 36
36 -
 37
37 -
 38
38 -
 39
39 -
 40
40 -
 41
41 -
 42
42 -
 43
43 -
 44
44 -
 45
45 -
 46
46 -
 47
47 -
 48
48 -
49
-
50
-
51
-
52
-
53
-
54
-
55
-
56
-
57
-
58
-
59
-
60
-
61
-
62
-
63
-
64
-
65
-
66
-
67
-
68
-
69
-
70
-
71
-
72
-
73
-
74
-
75
-
76
-
77
-
78
-
79
-
80
-
81
-
82
-
83
-
84
-
85
-
86
-
87
-
88
-
89
-
90
-
91
-
92
-
93
-
94
-
95
-
96
 |
 |

36 Xerox 2009 Annual Report
Management’s Discussion
Net cash used in financing activities was $311 million for the year ended
December 31, 2008. The $308 million increase from 2007 was primarily
due to the following:
•$1,642 million increase from lower net repayments on secured debt.
2007 reflects termination of our secured financing programs with
GE in the United Kingdom and Canada of $634 million and Merrill
Lynch in France for $469 million, as well as the repayment of secured
borrowings to DLL of $153 million. The remainder reflects lower
payments associated with our GE U.S. secured borrowings.
•$888 million decrease from lower net cash proceeds from unsecured
debt. 2008 reflects the issuance of $1.4 billion in Senior Notes,
$250 million from a private placement borrowing and net payments
of $354 million on the Credit Facility, and $370 million on other debt.
2007 reflects the issuance of $1.1 billion Senior Notes, $400 million
from private placement borrowings and net proceeds of $600 million
on the Credit Facility, offset by net payments of $286 million on
other debt.
•$180 million decrease due to additional purchases under our
share repurchase program.
•$154 million decrease due to common stock dividend payments.
•$79 million decrease due to lower proceeds from the issuance of
common stock, reflecting a decrease in stock option exercises as
well as lower related tax benefits.
•$33 million decrease due to share repurchases related to employee
withholding taxes on stock-based compensation vesting.
Financing Activities, Credit Facility and Capital Markets
CustomerFinancingActivities
We provide lease equipment financing to the majority of our customers.
Our lease contracts permit customers to pay for equipment over time
rather than at the date of installation. Our investment in these contracts
is reflected in Total finance assets, net. We currently fund our customer
financing activity through cash generated from operations, cash on
hand, borrowings under bank credit facilities and proceeds from capital
markets offerings.
We have arrangements in certain international countries and domestically
through GIS, where third-party financial institutions independently
provide lease financing, on a non-recourse basis to Xerox, directly to
our customers. In these arrangements, we sell and transfer title of
the equipment to these financial institutions. Generally, we have no
continuing ownership rights in the equipment subsequent to its sale;
therefore, the unrelated third-party finance receivable and debt are not
included in our Consolidated Financial Statements.
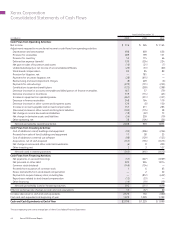
CashFlowsfromInvestingActivities
Net cash used in investing activities was $343 million for the year ended
December 31, 2009. The $98 million increase from 2008 was primarily
due to the following:
•$142 million increase due to lower capital expenditures (including
internal use software), reflecting very stringent spending controls.
•$21 million decrease due to lower cash proceeds from asset sales.
Net cash used in investing activities was $441 million for the year
ended December 31, 2008. The $1,171 million increase from 2007
was primarily due to the following:
•$1,460 million increase due to less cash used for acquisitions.
2008 acquisitions included $138 million for Veenman B.V. and
Saxon Business Systems, as compared to $1,568 million for GIS
and its additional acquisitions in the prior year.
•$192 million decrease due to lower funds from escrow and other
restricted investments in 2008. The prior year reflected funds
received from the run-off of our secured borrowing programs.
•$134 million decrease in other investing cash flows due to the
absence of proceeds from liquidations of short-term investments.
CashFlowsfromFinancingActivities
Net cash provided by financing activities was $692 million for the
year ended December 31, 2009. The $1,003 million increase from
2008 was primarily due to the following:
•$812 million increase because no purchases were made under
our share repurchase program during 2009.
•$170 million increase from lower net repayments on secured debt.
•$21 million increase due to lower share repurchases related to
employee withholding taxes on stock-based compensation vesting.
•$3 million decrease due to lower net debt proceeds. 2009 reflects
the repayment of $1,029 million for Senior Notes due in 2009, net
payments of $448 million for Zero Coupon Notes, net payments
of $246 million on the Credit Facility, net payments of $35 million
primarily for foreign short-term borrowings and $44 million of debt
issuance costs for the Bridge Loan Facility commitment, which was
recently terminated. These payments were partially offset by net
proceeds of $2,725 million from the issuance of Senior Notes in
May and December 2009. 2008 reflects the issuance of $1.4 billion in
Senior Notes, $250 million in Zero Coupon Notes and net payments
of $354 million on the Credit Facility and $370 million on other debt.