Xerox 2009 Annual Report Download - page 87
Download and view the complete annual report
Please find page 87 of the 2009 Xerox annual report below. You can navigate through the pages in the report by either clicking on the pages listed below, or by using the keyword search tool below to find specific information within the annual report.-
 1
1 -
2
-
3
-
4
-
5
-
6
-
7
-
8
-
9
-
10
-
11
-
12
-
13
-
14
-
15
-
16
-
17
-
18
-
19
-
20
-
21
-
22
-
23
-
24
-
25
-
26
-
27
-
28
-
29
-
30
-
31
-
32
-
33
-
34
-
35
-
36
-
37
-
38
-
39
-
40
-
41
-
42
-
43
-
44
-
45
-
46
-
47
-
48
-
49
-
50
-
51
-
52
-
53
-
54
-
55
-
56
-
57
-
58
-
59
-
60
-
61
-
62
-
63
-
64
-
65
-
66
-
67
-
68
-
69
-
70
-
71
-
72
-
73
-
74
-
75
-
76
-
 77
77 -
 78
78 -
 79
79 -
 80
80 -
 81
81 -
 82
82 -
 83
83 -
 84
84 -
 85
85 -
 86
86 -
 87
87 -
 88
88 -
 89
89 -
 90
90 -
 91
91 -
 92
92 -
 93
93 -
 94
94 -
 95
95 -
 96
96
 |
 |

85Xerox 2009 Annual Report
Notes to the Consolidated
Financial Statements
Dollars in millions, except per-share data and unless otherwise indicated.
We account for PSs using fair value determined as of the grant date.
If the stated targets are not met, any recognized compensation cost
would be reversed. As of December 31, 2009, there was $16 of total
unrecognized compensation cost related to nonvested PSs; this cost is
expected to be recognized ratably over a remaining weighted-average
contractual term of 1.1 years.
Stock options: Stock options generally vest over a period of three
years and expire between eight and 10 years from the date of grant.
We have not issued any new stock options since 2004 and all options
currently outstanding are fully vested and exercisable. The following
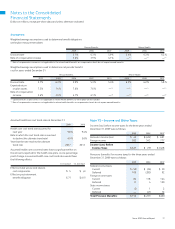
table provides information relating to the status of, and changes in,
outstanding stock options for each of the three years ended December
31, 2009 (stock options in thousands):
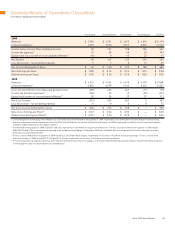
2009 2008 2007
Weighted Weighted Weighted
Stock Average Stock Average Stock Average
Employee Stock Options Options Option Price Options Option Price Options Option Price
Outstanding at January 1 45,185 $15.49 52,424 $19.73 60,480 $18.56
Cancelled/Expired (16,676) 24.68 (6,559) 50.08 (922) 24.18
Exercised (146) 5.88 (680) 8.89 (7,134) 9.22
Outstanding and Exercisable at December 31 28,363 10.13 45,185 15.49 52,424 19.73
At December 31, 2009, the aggregate intrinsic value of PSs outstanding
was $41. The total intrinsic value of PSs and the actual tax benefit
realized for the tax deductions for vested PSs for the two years ended
December 31, 2009 were as follows:
Vested Performance Shares 2009 2008
Total intrinsic value of vested PSs $15 $41
Tax benefit realized for vested PSs
tax deductions 6 13
Performance shares: We grant officers and selected executives PSs that
vest contingent upon meeting pre-determined Diluted Earnings per Share
(“EPS”) and Core Cash Flow from Operations targets. These shares entitle
the holder to one share of common stock, payable after a three-year
period and the attainment of the stated goals. If the cumulative three-year
actual results for EPS and Core Cash Flow from Operations exceed the
stated targets, then the plan participants have the potential to earn
additional shares of common stock. This overachievement can not exceed
50% for officers and 25% for non-officers of the original grant.
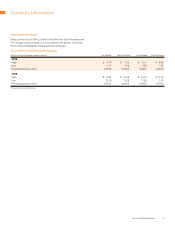
A summary of the activity for PSs as of December 31, 2009, 2008 and
2007, and changes during the years then ended, is presented below
(shares in thousands):
2009 2008 2007
Weighted Weighted Weighted
Average Grant Average Grant Average Grant
Nonvested Performance Shares Shares Date Fair Value Shares Date Fair Value Shares Date Fair Value
Outstanding at January 1 7,378 $ 15.39 6,585 $ 16.16 4,571 $ 15.04
Granted 718 15.17 3,696 13.67 2,160 18.48
Vested (3,075) 15.17 (2,734) 14.87 — —
Cancelled (147) 15.52 (169) 16.05 (146) 15.41
Outstanding at December 31 4,874 15.49 7,378 15.39 6,585 16.16