Xerox 2009 Annual Report Download - page 25
Download and view the complete annual report
Please find page 25 of the 2009 Xerox annual report below. You can navigate through the pages in the report by either clicking on the pages listed below, or by using the keyword search tool below to find specific information within the annual report.-
 1
1 -
2
-
3
-
4
-
5
-
6
-
7
-
8
-
9
-
10
-
11
-
12
-
13
-
14
-
 15
15 -
 16
16 -
 17
17 -
 18
18 -
 19
19 -
 20
20 -
 21
21 -
 22
22 -
 23
23 -
 24
24 -
 25
25 -
 26
26 -
 27
27 -
 28
28 -
 29
29 -
 30
30 -
 31
31 -
 32
32 -
 33
33 -
 34
34 -
 35
35 -
36
-
37
-
38
-
39
-
40
-
41
-
42
-
43
-
44
-
45
-
46
-
47
-
48
-
49
-
50
-
51
-
52
-
53
-
54
-
55
-
56
-
57
-
58
-
59
-
60
-
61
-
62
-
63
-
64
-
65
-
66
-
67
-
68
-
69
-
70
-
71
-
72
-
73
-
74
-
75
-
76
-
77
-
78
-
79
-
80
-
81
-
82
-
83
-
84
-
85
-
86
-
87
-
88
-
89
-
90
-
91
-
92
-
93
-
94
-
95
-
96
 |
 |

23Xerox 2009 Annual Report
Management’s Discussion
We continue to maintain debt levels primarily to support our
customer financing operations and, at the end of 2009, to fund the
ACS acquisition. Total Debt at December 31, 2009 of $9,264 million
increased $880 million from the prior year as net debt repayments
of approximately $1.8 billion were more than offset by the issuance
of $2,750 million in Senior Notes. Our 2009 public offerings included
$750 million of Senior Notes issued in May and $2.0 billion of Senior
Notes issued in December. The net proceeds from the December Senior
Notes offering were used in connection with the acquisition of ACS.
We finished the year with cash and cash equivalents of $3,799 billion,
which included funds subsequently used for the acquisition of ACS.
Our 2010 priorities include:
•Effective ACS transition, including synergies capture;
•Grow revenue and maintain leadership in innovation;
•Continue to aggressively manage spending and resize our cost
base to align to current revenues; and
•Drive operating cash flow and achieve debt reduction goals.
Our 2010 balance sheet and cash flow strategy includes: sustaining
our working capital improvements; maintaining our investment-grade
credit ratings; achieving an optimal cost of capital; and effectively
deploying cash to deliver and maximize shareholder value through
acquisitions and dividends. Our strategy also includes appropriately
leveraging our financing assets (finance receivables and equipment
on operating leases).
Currency Impacts
To understand the trends in our business, we believe that it is helpful
to analyze the impact of changes in the translation of foreign currencies
into U.S. Dollars on revenues and expenses. We refer to this analysis as
“currency impact” or “the impact from currency.” Revenues and expenses
from our developing markets are analyzed at actual exchange rates
for all periods presented, since these countries generally have volatile
currency and inflationary environments, and our operations in these
countries have historically implemented pricing actions to recover the
impact of inflation and devaluation. We do not hedge the translation
effect of revenues or expenses denominated in currencies where the
local currency is the functional currency.
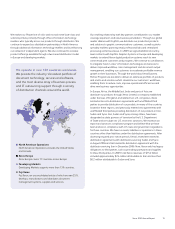
Approximately 50% of our consolidated revenues are derived from
operations outside of the United States where the U.S. Dollar is not
the functional currency. When compared with the average of the
major European currencies and Canadian Dollar on a revenue-weighted
basis, the U.S. Dollar was 7% stronger in 2009 and 3% weaker in
2008, each compared to the prior year. As a result, the foreign currency
translation impact on revenue was a 3% detriment in 2009 and a
1% benefit in 2008.
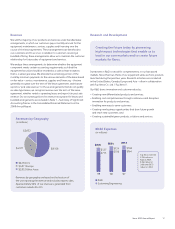
The overall slowdown in business activity reduced print volumes,
especially in heavily document-driven processes, and our customers,
in an effort to manage costs, are delaying spending on technology
upgrades until there are stronger signs of economic improvement.
The weak economies in developing markets, like Russia and Eurasia,
where access to credit is still quite limited, also impacted our revenues.
We reacted to these challenges by prioritizing cash generation and
taking actions on cost and expense to help mitigate the effects of
lower revenue.
The following is a summary of key 2009 highlights:
• Delivered strong operating cash flow and reduced spending;
• Operational performance continues to improve sequentially;
• Competitive position strengthened through innovative technology
and industry-leading Managed Print Services offering; and
• ACS acquisition opens new market opportunities and strengthens
financial position.
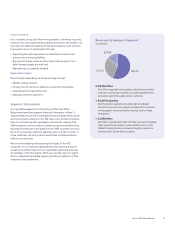
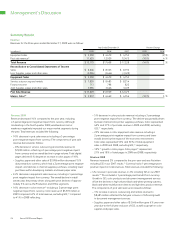
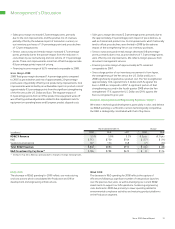
Total revenue of $15,179 million for 2009 declined 14% from the prior
year, including a 3-percentage point negative impact from currency.
Equipment sales of $3,550 million for 2009 decreased 24% from the
prior year, primarily reflecting the continued industry-wide slowdown
in technology spending. Post sale revenue of $11,629 million for 2009
was down 10% from the prior year, primarily reflecting lower supplies
revenue as distributors maintained lower inventory levels and businesses
implemented their own cost-cutting measures.
The benefits from restructuring and operational cost improvements
helped to relieve the pressure from revenue declines. Gross margins of
39.7% for 2009 increased 0.8-percentage points from the prior year
despite the continued effect of higher product costs due to the strength
of the Japanese Yen. Selling, administrative and general expenses
(“SAG”) for 2009 declined $385 million, reflecting favorable currency, the
benefits from restructuring and operational cost improvements, partially
offset by increased bad debt expense.
Cash flows from operations of $2,208 million in 2009 were primarily
driven by working capital improvements. Cash used in investing activities
of $343 million reflected well-controlled capital expenditures of $193
million, as well as $145 million for GIS’s acquisition of ComDoc in the
first quarter of 2009.