Xerox 2009 Annual Report Download - page 56
Download and view the complete annual report
Please find page 56 of the 2009 Xerox annual report below. You can navigate through the pages in the report by either clicking on the pages listed below, or by using the keyword search tool below to find specific information within the annual report.-
 1
1 -
2
-
3
-
4
-
5
-
6
-
7
-
8
-
9
-
10
-
11
-
12
-
13
-
14
-
15
-
16
-
17
-
18
-
19
-
20
-
21
-
22
-
23
-
24
-
25
-
26
-
27
-
28
-
29
-
30
-
31
-
32
-
33
-
34
-
35
-
36
-
37
-
38
-
39
-
40
-
41
-
42
-
43
-
44
-
45
-
 46
46 -
 47
47 -
 48
48 -
 49
49 -
 50
50 -
 51
51 -
 52
52 -
 53
53 -
 54
54 -
 55
55 -
 56
56 -
 57
57 -
 58
58 -
 59
59 -
 60
60 -
 61
61 -
 62
62 -
 63
63 -
 64
64 -
 65
65 -
 66
66 -
67
-
68
-
69
-
70
-
71
-
72
-
73
-
74
-
75
-
76
-
77
-
78
-
79
-
80
-
81
-
82
-
83
-
84
-
85
-
86
-
87
-
88
-
89
-
90
-
91
-
92
-
93
-
94
-
95
-
96
 |
 |

54 Xerox 2009 Annual Report
Notes to the Consolidated
Financial Statements
Dollars in millions, except per-share data and unless otherwise indicated.
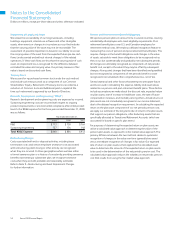
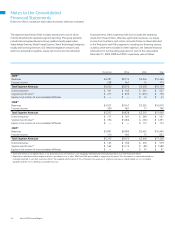
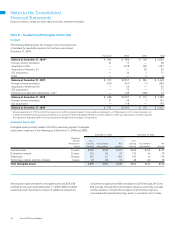
Corporate items. Other segment profit (loss) includes the operating
results from these entities, other less-significant businesses, our equity
income from Fuji Xerox, and certain costs which have not been allocated
to the Production and Office segments, including non-financing interest,
as well as other items included in Other expenses, net. Selected financial
information for our Operating segments for each of the years ended
December 31, 2009, 2008 and 2007, respectively, was as follows:
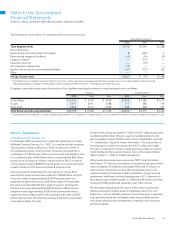
The segment classified as Other includes several units, none of which
met the thresholds for separate segment reporting. This group primarily
includes Xerox Supplies Business Group (predominantly paper sales),
Value-Added Services, Wide Format Systems, Xerox Technology Enterprises,
royalty and licensing revenues, GIS network integration solutions and
electronic presentation systems, equity net income and non-allocated
Production Office Other Total
2009(1)
Revenues $ 4,287 $ 8,135 $ 2,044 $ 14,466
Finance income 258 441 14 713
Total Segment Revenues $ 4,545 $ 8,576 $ 2,058 $ 15,179
Interest expense $ 101 $ 165 $ 261 $ 527
Segment profit (loss)(2) $ 217 $ 835 $ (274) $ 778
Equity in net income of unconsolidated affiliates $ — $ — $ 41 $ 41
2008(1)
Revenues $ 4,937 $ 9,347 $ 2,526 $ 16,810
Finance income 300 481 17 798
Total Segment Revenues $ 5,237 $ 9,828 $ 2,543 $ 17,608
Interest expense $ 117 $ 181 $ 269 $ 567
Segment profit (loss)(2) $ 394 $ 1,062 $ (165) $ 1,291
Equity in net income of unconsolidated affiliates $ — $ — $ 113 $ 113
2007(1)
Revenues $ 5,001 $ 8,980 $ 2,425 $ 16,406
Finance income 314 493 15 822
Total Segment Revenues $ 5,315 $ 9,473 $ 2,440 $ 17,228
Interest expense $ 123 $ 186 $ 270 $ 579
Segment profit (loss)(2) $ 562 $ 1,115 $ (89) $ 1,588
Equity in net income of unconsolidated affiliates $ — $ — $ 97 $ 97
(1) Asset information on a segment basis is not disclosed, as this information is not separately identified and internally reported to our chief executive officer.
(2) Depreciation and amortization expense, which is recorded in cost of sales, RD&E and SAG are included in segment profit above. This information is neither identified nor
internally reported to our chief executive officer. The separate identification of this information for purposes of segment disclosure is impracticable, as it is not readily
available and the cost to develop it would be excessive.