Xerox 2009 Annual Report Download - page 3
Download and view the complete annual report
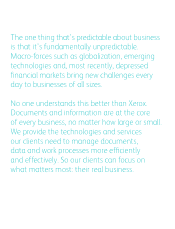
Please find page 3 of the 2009 Xerox annual report below. You can navigate through the pages in the report by either clicking on the pages listed below, or by using the keyword search tool below to find specific information within the annual report.-
 1
1 -
 2
2 -
 3
3 -
 4
4 -
 5
5 -
 6
6 -
 7
7 -
 8
8 -
 9
9 -
 10
10 -
 11
11 -
 12
12 -
 13
13 -
 14
14 -
15
-
16
-
17
-
18
-
19
-
20
-
21
-
22
-
23
-
24
-
25
-
26
-
27
-
28
-
29
-
30
-
31
-
32
-
33
-
34
-
35
-
36
-
37
-
38
-
39
-
40
-
41
-
42
-
43
-
44
-
45
-
46
-
47
-
48
-
49
-
50
-
51
-
52
-
53
-
54
-
55
-
56
-
57
-
58
-
59
-
60
-
61
-
62
-
63
-
64
-
65
-
66
-
67
-
68
-
69
-
70
-
71
-
72
-
73
-
74
-
75
-
76
-
77
-
78
-
79
-
80
-
81
-
82
-
83
-
84
-
85
-
86
-
87
-
88
-
89
-
90
-
91
-
92
-
93
-
94
-
95
-
96
 |
 |

* See Page 7 for the reconciliation of the difference between this financial measure that is not in compliance with
Generally Accepted Accounting Principles (GAAP) and the most directly comparable financial measure calculated in
accordance with GAAP.
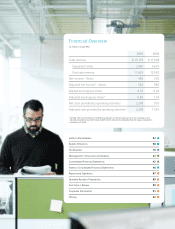
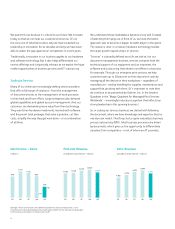
Financial Overview
(in millions, except EPS)
2009 2008
Total revenue $ 15,179 $ 17,608
Equipment sales 3,550 4,679
Post-sale revenue 11,629 12,929
Net income – Xerox 485 230
Adjusted net income* – Xerox 526 985
Diluted earnings per share 0.55 0.26
Adjusted earnings per share* 0.60 1.10
Net cash provided by operating activities 2,208 939
Adjusted cash provided by operating activities* 2,208 1,554
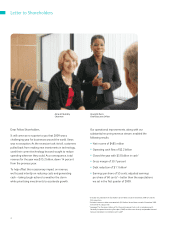
Letter to Shareholders 02
Board of Directors 08
Our Business 10
Management’s Discussion and Analysis 22
Consolidated Financial Statements 42
Notes to Consolidated Financial Statements 46
Reports and Signatures 87
Quarterly Results of Operations 89
Five Years in Review 90
Corporate Information 91
Officers 92