Xerox 2009 Annual Report Download - page 27
Download and view the complete annual report
Please find page 27 of the 2009 Xerox annual report below. You can navigate through the pages in the report by either clicking on the pages listed below, or by using the keyword search tool below to find specific information within the annual report.-
 1
1 -
2
-
3
-
4
-
5
-
6
-
7
-
8
-
9
-
10
-
11
-
12
-
13
-
14
-
15
-
16
-
 17
17 -
 18
18 -
 19
19 -
 20
20 -
 21
21 -
 22
22 -
 23
23 -
 24
24 -
 25
25 -
 26
26 -
 27
27 -
 28
28 -
 29
29 -
 30
30 -
 31
31 -
 32
32 -
 33
33 -
 34
34 -
 35
35 -
 36
36 -
 37
37 -
38
-
39
-
40
-
41
-
42
-
43
-
44
-
45
-
46
-
47
-
48
-
49
-
50
-
51
-
52
-
53
-
54
-
55
-
56
-
57
-
58
-
59
-
60
-
61
-
62
-
63
-
64
-
65
-
66
-
67
-
68
-
69
-
70
-
71
-
72
-
73
-
74
-
75
-
76
-
77
-
78
-
79
-
80
-
81
-
82
-
83
-
84
-
85
-
86
-
87
-
88
-
89
-
90
-
91
-
92
-
93
-
94
-
95
-
96
 |
 |

25Xerox 2009 Annual Report
Management’s Discussion
•$292 million after-tax charge ($426 million pre-tax) for the
second, third and fourth quarter 2008 restructuring and asset
impairment actions.
•$24 million after-tax charge ($39 million pre-tax) for an Office
product line equipment write-off.
•$41 million income tax benefit from the settlement of certain
previously unrecognized tax benefits.
Application of Critical Accounting Policies
In preparing our Consolidated Financial Statements and accounting
for the underlying transactions and balances, we apply various
accounting policies. Senior management has discussed the development
and selection of the critical accounting policies, estimates and related
disclosures included herein with the Audit Committee of the Board
of Directors. We consider the policies discussed below as critical
to understanding our Consolidated Financial Statements, as their
application places the most significant demands on management’s
judgment, since financial reporting results rely on estimates of the
effects of matters that are inherently uncertain. In instances where
different estimates could have reasonably been used, we disclosed
the impact of these different estimates on our operations. In certain
instances, like revenue recognition for leases, the accounting rules are
prescriptive; therefore, it would not have been possible to reasonably
use different estimates. Changes in assumptions and estimates are
reflected in the period in which they occur. The impact of such changes
could be material to our results of operations and financial condition
in any quarterly or annual period.
Specific risks associated with these critical accounting policies are
discussed throughout the MD&A, where such policies affect our
reported and expected financial results. For a detailed discussion of
the application of these and other accounting policies, refer to Note
1 – Summary of Significant Accounting Policies, in the Consolidated
Financial Statements.
RevenueRecognitionforLeases
Our accounting for leases involves specific determinations under
applicable lease accounting standards, which often involve complex
and prescriptive provisions. These provisions affect the timing of
revenue recognition for our equipment. If a lease qualifies as a sales-
type capital lease, equipment revenue is recognized upon delivery or
installation of the equipment as sale revenue as opposed to ratably
over the lease term. The critical elements that we consider with respect
to our lease accounting are the determination of the economic life
and the fair value of equipment, including the residual value. For
purposes of determining the economic life, we consider the most
objective measure to be the original contract term, since most equip-
ment is returned by lessees at or near the end of the contracted term.
The economic life of most of our products is five years, since this
represents the most frequent contractual lease term for our principal
products and only a small percentage of our leases are for original terms
longer than five years. There is no significant after-market for our used
equipment. We believe five years is representative of the period during
which the equipment is expected to be economically usable, with normal
service, for the purpose for which it is intended.
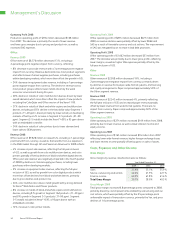
• 2% decrease in equipment sales revenue. There was no impact from
currency on equipment sales revenue. When including GIS in our 2007
results,(5) equipment sales revenue decreased 5%, with a 1-percentage
point benefit from currency. Overall price declines of between
5%–10%, as well as product mix, more than offset overall growth
in install activity.
• 5% growth in color revenue.(2) Color revenue of $6,669 million in
2008 represented 41% of total revenue, excluding GIS,(3) compared
to 39% in 2007, reflecting:
– 10% growth in color post sale revenue to $4,590 million. Color
post sale revenue represented 37% and 35% of post sale revenue
in 2008 and 2007, respectively.(3)
– Color equipment sales revenue declined 4% to $2,079 million.
Color equipment sales represented 50% of total equipment sales
in 2008 and 2007, respectively.(3)
– 24%(4) growth in color pages. Color pages(4) represented 18% and
12% of total pages in 2008 and 2007, respectively.
(1) Post sale revenue is largely a function of the equipment placed at customer
locations, the volume of prints and copies that our customers make on that
equipment, the mix of color pages and associated services.
(2) Color revenues represent a subset of total revenue and excludes the impact
of GIS’s revenues.
(3) As of December 31, 2009 and 2008, total color, color post sale and color
equipment sales revenues comprised 39%, 37% and 46%; and 38%, 36% and
44%, respectively, if calculated on total, total post sale, and total equipment sales
revenues, including GIS. GIS is excluded from the color information presented because
the breakout of the information required to make this computation for all periods
is not available.
(4) Pages include estimates for developing markets, GIS and printers.
(5) The percentage point impacts from GIS reflect the revenue growth year-over-year
after including GIS’s results for 2007 on a pro forma basis. We acquired GIS in
May 2007. See “Non-GAAP Financial Measures” section for an explanation of this
non-GAAP measure.
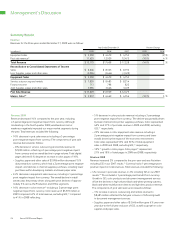
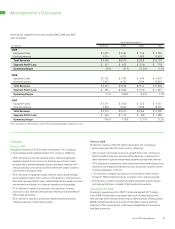
Net Income
Net income and diluted earnings per share for the three years ended
December 31, 2009 were as follows:
(in millions, except per-share amounts) 2009 2008 2007
Net income attributable to Xerox $ 485 $ 230 $ 1,135
Diluted earnings per share $ 0.55 $ 0.26 $ 1.19
NetIncome2009
Net income attributable to Xerox of $485 million, or $0.55 per diluted
share, included the following:
•A $49 million after-tax ($72 million pre-tax) charge, or $0.06 per
diluted share, related to costs associated with the acquisition of ACS.
•A charge of $46 million, or $0.05 per diluted share, for our share of
Fuji Xerox’s after-tax restructuring charge.
NetIncome2008
Net income of $230 million, or $0.26 per diluted share, included
the following:
•$491 million after-tax charges ($774 million pre-tax) associated
with securities-related litigation matters, as well as other probable
litigation-related losses, including $36 million for the Brazilian
labor-related contingencies.