Xerox 2009 Annual Report Download - page 34
Download and view the complete annual report
Please find page 34 of the 2009 Xerox annual report below. You can navigate through the pages in the report by either clicking on the pages listed below, or by using the keyword search tool below to find specific information within the annual report.-
 1
1 -
2
-
3
-
4
-
5
-
6
-
7
-
8
-
9
-
10
-
11
-
12
-
13
-
14
-
15
-
16
-
17
-
18
-
19
-
20
-
21
-
22
-
23
-
 24
24 -
 25
25 -
 26
26 -
 27
27 -
 28
28 -
 29
29 -
 30
30 -
 31
31 -
 32
32 -
 33
33 -
 34
34 -
 35
35 -
 36
36 -
 37
37 -
 38
38 -
 39
39 -
 40
40 -
 41
41 -
 42
42 -
 43
43 -
 44
44 -
45
-
46
-
47
-
48
-
49
-
50
-
51
-
52
-
53
-
54
-
55
-
56
-
57
-
58
-
59
-
60
-
61
-
62
-
63
-
64
-
65
-
66
-
67
-
68
-
69
-
70
-
71
-
72
-
73
-
74
-
75
-
76
-
77
-
78
-
79
-
80
-
81
-
82
-
83
-
84
-
85
-
86
-
87
-
88
-
89
-
90
-
91
-
92
-
93
-
94
-
95
-
96
 |
 |

32 Xerox 2009 Annual Report
Management’s Discussion
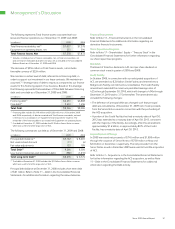
Restructuring and Asset Impairment Charges
For the years ended December 31, 2009, 2008 and 2007, we
recorded net restructuring and asset impairment (credits)/charges
of $(8) million, $429 million and $(6) million, respectively.
•Restructuring activity was minimal in 2009, and the credit of
$8 million primarily reflected changes in estimates for prior
years’ initiatives.
•The 2008 net charge included $357 million related to head count
reductions of approximately 4,900 employees, primarily in North
America and Europe, and lease termination and asset impairment
charges of $72 million, primarily reflecting the exit from certain
leased and owned facilities resulting from a rationalization of our
worldwide operating locations. These actions applied equally to
both North America and Europe, with approximately half focused
on SAG reductions, approximately a third on gross margin
improvements and the remainder focused on the optimization
of RD&E investments. Estimated savings from these initiatives
were approximately $250 million in 2009.
•Restructuring activity was minimal in 2007 and the related credit
of $6 million primarily reflected changes in estimates for prior
year’s severance costs.
The restructuring reserve balance as of December 31, 2009 for all
programs was $74 million, of which approximately $64 million is expected
to be spent over the next 12 months. Refer to Note 9 – Restructuring
and Asset Impairment Charges in the Consolidated Financial Statements
for further information regarding our restructuring programs.
2010ExpectedActions
In connection with our continued objective to align our cost base to
current revenues, we expect to record pre-tax restructuring charges of
approximately $280 million in 2010, of which $250 million is expected
to be recorded in the first quarter. These actions are expected to
impact all geographies and segments, with approximately equal focus
on SAG reductions, gross margin improvements and optimization of
RD&E investments. The restructuring is also expected to involve the
rationalization of some of our facilities.
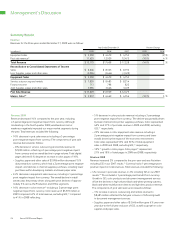
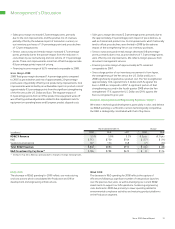
Selling, Administrative and General Expenses (“SAG”)
Year Ended December 31, Change
(in millions) 2009 2008 2007 2009 2008
Total SAG $ 4,149 $ 4,534 $ 4,312 $ (385) $ 222
SAG as a % of Revenue 27.3% 25.7% 25.0% 1.6 pts 0.7 pts
Bad Debt Expense $ 291 $ 188 $ 134 $ 103 $ 54
Bad Debt as a % of Revenue 1.9% 1.1% 0.8% 0.8 pts 0.3 pts
SAG2009
SAG of $4,149 million was $385 million lower than 2008, including
a $126 million benefit from currency. The SAG decrease was the result
of the following:
•$311 million decrease in selling expenses reflecting favorable currency,
benefits from restructuring, an overall reduction in marketing spend
and lower commissions.
•$177 million decrease in general and administrative (“G&A”) expenses
reflecting favorable currency and benefits from restructuring and cost
actions partially offset by higher compensation accruals.
•$103 million increase in bad debt expense reflecting increased
write-offs in North America and Europe.
SAG2008
SAG of $4,534 million was $222 million higher than 2007, including
a $12 million unfavorable impact from currency. The SAG increase
was the result of the following:
•$94 million increase in selling expenses, primarily reflecting the
full-year inclusion of GIS, investments in selling resources and
marketing communications, and unfavorable currency partially
offset by lower compensation.
•$75 million increase in G&A expenses, primarily from the full-year
inclusion of GIS and unfavorable currency.
•$54 million increase in bad debt expense, reflecting increased write-
offs, particularly in the fourth quarter 2008, which included several
high-value account bankruptcies in the U.S., U.K. and Germany.
Bad debt expense, which is included in SAG, increased $103 million
in 2009 and reserves as a percentage of trade and finance receivables
increased to 4.1% at December 31, 2009 as compared to 3.4% at
December 31, 2008. These increases reflect the weak worldwide
eco nomic conditions and the increased level of customer bankruptcies
in certain industry groups during the year. Bad debts provision and
write-offs in the fourth quarter 2009 were flat as compared to the
prior year.