Xerox 2009 Annual Report Download - page 26
Download and view the complete annual report
Please find page 26 of the 2009 Xerox annual report below. You can navigate through the pages in the report by either clicking on the pages listed below, or by using the keyword search tool below to find specific information within the annual report.-
 1
1 -
2
-
3
-
4
-
5
-
6
-
7
-
8
-
9
-
10
-
11
-
12
-
13
-
14
-
15
-
 16
16 -
 17
17 -
 18
18 -
 19
19 -
 20
20 -
 21
21 -
 22
22 -
 23
23 -
 24
24 -
 25
25 -
 26
26 -
 27
27 -
 28
28 -
 29
29 -
 30
30 -
 31
31 -
 32
32 -
 33
33 -
 34
34 -
 35
35 -
 36
36 -
37
-
38
-
39
-
40
-
41
-
42
-
43
-
44
-
45
-
46
-
47
-
48
-
49
-
50
-
51
-
52
-
53
-
54
-
55
-
56
-
57
-
58
-
59
-
60
-
61
-
62
-
63
-
64
-
65
-
66
-
67
-
68
-
69
-
70
-
71
-
72
-
73
-
74
-
75
-
76
-
77
-
78
-
79
-
80
-
81
-
82
-
83
-
84
-
85
-
86
-
87
-
88
-
89
-
90
-
91
-
92
-
93
-
94
-
95
-
96
 |
 |

24 Xerox 2009 Annual Report
Management’s Discussion
– 5% decrease in color post sale revenue including a 3-percentage
point negative impact from currency. The decline was partially driven
by lower channel color printer supplies purchases. Color represented
40% and 37% of post sale revenue in 2009 and 2008, excluding
GIS,(3) respectively.
– 22% decrease in color equipment sales revenue including a
2-percentage point negative impact from currency and lower
installs driven by the impact of the economic environment.
Color sales represented 53% and 50% of total equipment
sales in 2009 and 2008, excluding GIS,(3) respectively.
– 10%(4) growth in color pages. Color pages(4) represented
21% and 18% of total pages in 2009 and 2008, respectively.
Revenue2008
Revenue increased 2% compared to the prior year and was flat when
including GIS in our 2007 results.(5) Currency had a 1-percentage point
positive impact on total revenues. Total revenues included the following:
• 4% increase in post sale revenue, or 2% including GIS in our 2007
results.(5) This included a 1-percentage point benefit from currency.
Growth in GIS, color products and document management services
offset the declines in high-volume black-and-white printing systems,
black-and-white multifunction devices and light lens product revenue.
The components of post sale revenue increased as follows:
– 3% increase in service, outsourcing and rentals revenue to
$8,485 million reflected the full-year inclusion of GIS and growth
in document management services.
– Supplies, paper and other sales of $3,646 million grew 6% year-over-
year due to the full-year inclusion of GIS, as well as growth in color
supplies and paper sales.
Revenue2009
Revenue decreased 14% compared to the prior year, including
a 3-percentage point negative impact from currency. Although
moderating in the fourth quarter 2009, worldwide economic
weakness negatively impacted our major market segments during
the year. Total revenues included the following:
• 10% decrease in post sale revenue including a 3-percentage
point negative impact from currency. The components of post sale
revenue decreased as follows:
– 8% decrease in service, outsourcing and rentals revenue to
$7,820 million, reflecting a 3-percentage point negative impact
from currency and an overall decline in page volume. Total digital
pages declined 6% despite an increase in color pages of 10%.
– Supplies, paper and other sales of $3,096 million decreased 15%
due primarily to currency, which had a 2-percentage point negative
impact, and declines in channel supplies purchases, including lower
purchases within developing markets, and lower paper sales.
• 24% decrease in equipment sales revenue, including a 1-percentage
point negative impact from currency. The overall decline in install
activity was the primary driver, along with price declines of approxi-
mately 5% across the Production and Office segments.
• 10% decrease in color revenue(2) including a 2-percentage point
negative impact from currency. Color revenue of $5,972 million in
2009 comprised 43% of total revenue, excluding GIS,(3) compared
to 41% in 2008 reflecting:
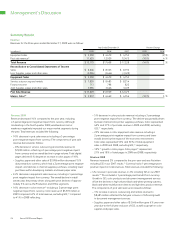
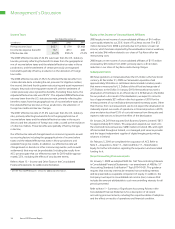
Summary Results
Revenue
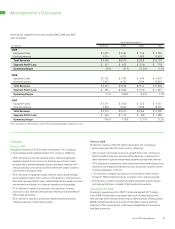
Revenues for the three years ended December 31, 2009 were as follows:
Year Ended December 31, Percent Change
(in millions) 2009 2008 2007 2009 2008
Equipment sales $ 3,550 $ 4,679 $ 4,753 (24)% (2)%
Post sale revenue(1) 11,629 12,929 12,475 (10)% 4 %
Total Revenue $ 15,179 $ 17,608 $ 17,228 (14)% 2 %
Reconciliation to Consolidated Statements of Income
Sales $ 6,646 $ 8,325 $ 8,192
Less: Supplies, paper and other sales (3,096) (3,646) (3,439)
Equipment Sales $ 3,550 $ 4,679 $ 4,753
Service, outsourcing and rentals $ 7,820 $ 8,485 $ 8,214
Finance income 713 798 822
Add: Supplies, paper and other sales 3,096 3,646 3,439
Post Sale Revenue $ 11,629 $ 12,929 $ 12,475
Memo: Color(2) $ 5,972 $ 6,669 $ 6,356 (10)% 5 %