Xerox 2009 Annual Report Download - page 43
Download and view the complete annual report
Please find page 43 of the 2009 Xerox annual report below. You can navigate through the pages in the report by either clicking on the pages listed below, or by using the keyword search tool below to find specific information within the annual report.-
 1
1 -
2
-
3
-
4
-
5
-
6
-
7
-
8
-
9
-
10
-
11
-
12
-
13
-
14
-
15
-
16
-
17
-
18
-
19
-
20
-
21
-
22
-
23
-
24
-
25
-
26
-
27
-
28
-
29
-
30
-
31
-
32
-
 33
33 -
 34
34 -
 35
35 -
 36
36 -
 37
37 -
 38
38 -
 39
39 -
 40
40 -
 41
41 -
 42
42 -
 43
43 -
 44
44 -
 45
45 -
 46
46 -
 47
47 -
 48
48 -
 49
49 -
 50
50 -
 51
51 -
 52
52 -
 53
53 -
54
-
55
-
56
-
57
-
58
-
59
-
60
-
61
-
62
-
63
-
64
-
65
-
66
-
67
-
68
-
69
-
70
-
71
-
72
-
73
-
74
-
75
-
76
-
77
-
78
-
79
-
80
-
81
-
82
-
83
-
84
-
85
-
86
-
87
-
88
-
89
-
90
-
91
-
92
-
93
-
94
-
95
-
96
 |
 |

41Xerox 2009 Annual Report
Management’s Discussion
Year Ended December 31,
(in millions) 2008 2007 Change
Equipment Sales Revenue:
As Reported $ 4,679 $ 4,753 (2)%
As Adjusted $ 4,679 $ 4,938 (5)%
Post Sale Revenue:
As Reported $ 12,929 $ 12,475 4 %
As Adjusted $ 12,929 $ 12,681 2 %
Total Revenues:
As Reported $ 17,608 $ 17,228 2 %
As Adjusted $ 17,608 $ 17,619 —
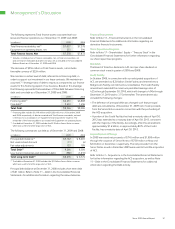
AdjustedEffectiveTaxRate
The effective tax rate for the year ended December 31, 2008 is dis-
cussed using a non-GAAP financial measure that excludes the effect
of charges associated with an equipment write-off; restructuring and
asset impairments; certain litigation matters and the settlement of
certain previously unrecognized tax benefits. Management believes that
it is helpful to exclude these effects to better understand, analyze and
compare 2008’s income tax expense and effective tax rate to the 2007
amounts, given the discrete nature and size of these items in 2008.
Year Ended December 31, 2008
Pre-Tax Income Effective
(in millions) Income Taxes Tax Rate
As Reported $ (79) $ (231) 292.4%
Restructuring and asset
impairment charges 426 134
Equipment write-off 39 15
Provision for securities
litigation matters 774 283
Tax settlements — 41
As Adjusted $ 1,160 $ 242 20.9%
Management believes that these non-GAAP financial measures provide
an additional means of analyzing the current-period results against
the corresponding prior-period results. However, non-GAAP financial
measures should be viewed in addition to, and not as a substitute for,
the Company’s reported results prepared in accordance with GAAP.
Forward-Looking Statements
This Annual Report contains forward-looking statements as defined
in the Private Securities Litigation Reform Act of 1995. The words
“anticipate,” “believe,” “estimate,” “expect,” “intend,” “will,” “should”
and similar expressions, as they relate to us, are intended to identify
forward-looking statements. These statements reflect management’s
current beliefs, assumptions and expectations and are subject to a
number of factors that may cause actual results to differ materially.
Information concerning these factors is included in our 2009 Annual
Report on Form 10-K filed with the Securities and Exchange Commission
(“SEC”). We do not intend to update these forward-looking statements,
except as required by law.
ForeignExchangeRiskManagement
Assuming a 10% appreciation or depreciation in foreign currency
exchange rates from the quoted foreign currency exchange rates at
December 31, 2009, the potential change in the fair value of foreign
currency-denominated assets and liabilities in each entity would not be
significant because all material currency asset and liability exposures
were economically hedged as of December 31, 2009. A 10% appreciation
or depreciation of the U.S. Dollar against all currencies from the quoted
foreign currency exchange rates at December 31, 2009 would have a
$689 million impact on our cumulative translation adjustment portion
of equity. The net amount invested in foreign subsidiaries and affiliates,
primarily Xerox Limited, Fuji Xerox, Xerox Canada Inc. and Xerox do
Brasil, and translated into Dollars using the year-end exchange rates,
was $6.9 billion at December 31, 2009.
InterestRateRiskManagement
The consolidated weighted-average interest rates related to our total
debt and liability to subsidiary trust issuing preferred securities for 2009,
2008 and 2007 approximated 6.1%, 6.6% and 7.1%, respectively.
Interest expense includes the impact of our interest rate derivatives.
Virtually all customer-financing assets earn fixed rates of interest.
The interest rates on a significant portion of the Company’s term
debt are fixed.
As of December 31, 2009 $2.4 billion of our total debt carried variable
interest rates, including the effect of pay variable interest rate swaps we
are utilizing with the intent to reduce the effective interest rate on our
fixed coupon debt.
The fair market values of our fixed-rate financial instruments are
sensitive to changes in interest rates. At December 31, 2009 a
10% change in market interest rates would change the fair values
of such financial instruments by approximately $274 million.
Non-GAAP Financial Measures
We have reported our financial results in accordance with generally
accepted accounting principles (“GAAP”). A reconciliation of the
following non-GAAP financial measures to the most directly comparable
financial measures calculated and presented in accordance with
GAAP are set forth below:
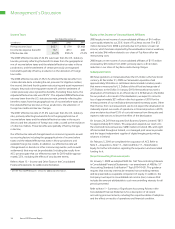
AdjustedRevenue
We discussed the revenue growth for the year ended December 31,
2008 using non-GAAP financial measures. To understand trends in
the business, we believe that it is helpful to adjust the revenue growth
rates to illustrate the impact of the acquisition of GIS by including their
estimated revenue for the comparable 2007 period. We refer to this
adjusted revenue as “As Adjusted” in the following reconciliation table.
Revenue “As Adjusted” adds GIS’s revenues from January 1, 2007 to
May 8, 2007 to our 2007 reported revenue. Management believes these
measures give investors an additional perspective on revenue trends,
as well as the impact to the Company of the acquisition of GIS that was
completed in May 2007.