Xerox 2009 Annual Report Download - page 77
Download and view the complete annual report
Please find page 77 of the 2009 Xerox annual report below. You can navigate through the pages in the report by either clicking on the pages listed below, or by using the keyword search tool below to find specific information within the annual report.-
 1
1 -
2
-
3
-
4
-
5
-
6
-
7
-
8
-
9
-
10
-
11
-
12
-
13
-
14
-
15
-
16
-
17
-
18
-
19
-
20
-
21
-
22
-
23
-
24
-
25
-
26
-
27
-
28
-
29
-
30
-
31
-
32
-
33
-
34
-
35
-
36
-
37
-
38
-
39
-
40
-
41
-
42
-
43
-
44
-
45
-
46
-
47
-
48
-
49
-
50
-
51
-
52
-
53
-
54
-
55
-
56
-
57
-
58
-
59
-
60
-
61
-
62
-
63
-
64
-
65
-
66
-
 67
67 -
 68
68 -
 69
69 -
 70
70 -
 71
71 -
 72
72 -
 73
73 -
 74
74 -
 75
75 -
 76
76 -
 77
77 -
 78
78 -
 79
79 -
 80
80 -
 81
81 -
 82
82 -
 83
83 -
 84
84 -
 85
85 -
 86
86 -
 87
87 -
88
-
89
-
90
-
91
-
92
-
93
-
94
-
95
-
96
 |
 |
75Xerox 2009 Annual Report
Notes to the Consolidated
Financial Statements
Dollars in millions, except per-share data and unless otherwise indicated.
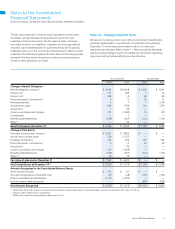
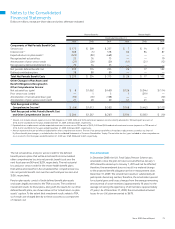
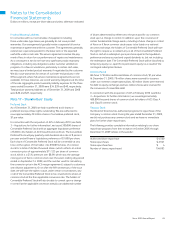
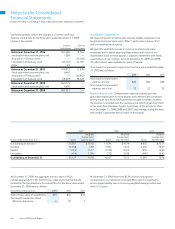
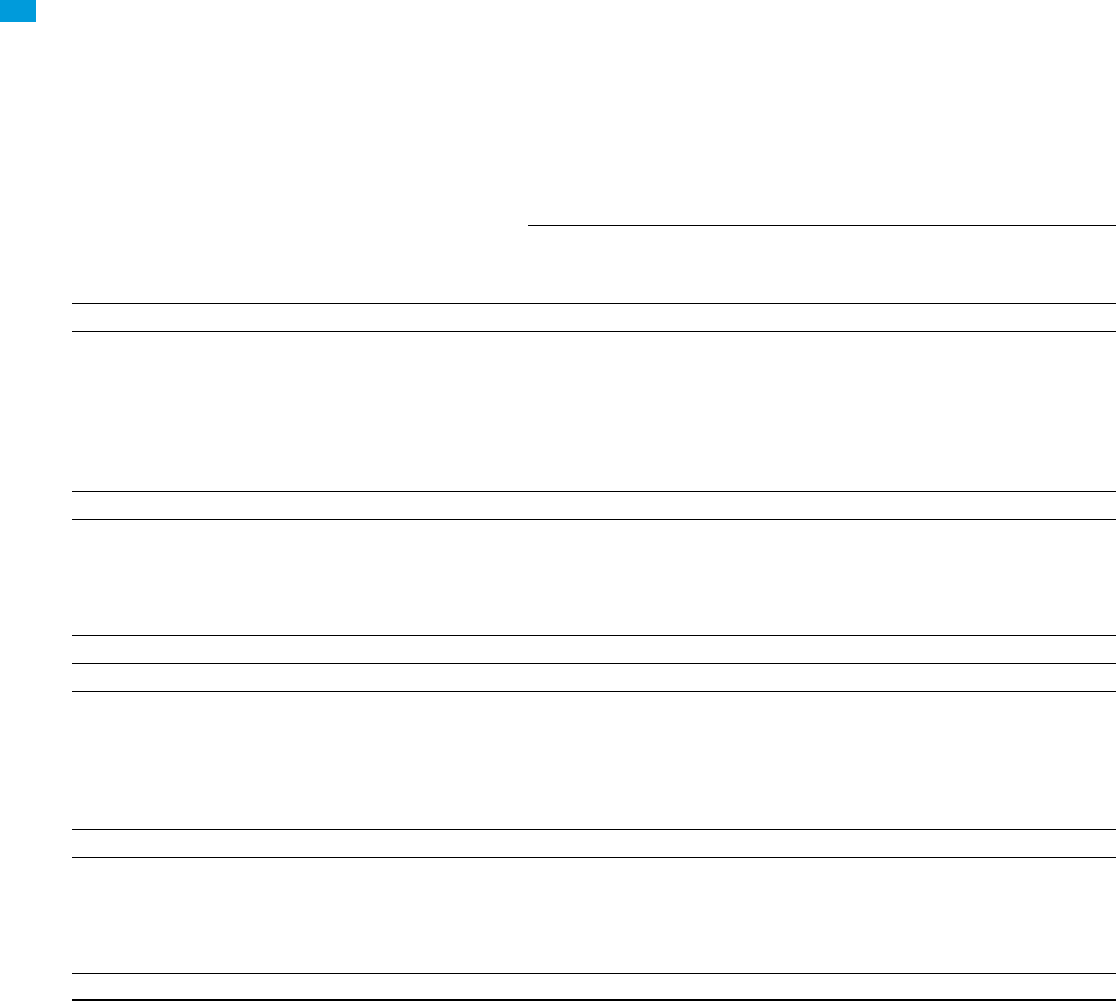
The following table presents the defined benefit plans’ assets measured
at fair value at December 31, 2008 and the basis for that measurement:
Valuation Based on:
Quoted Prices in Significant Other Significant Total
Active Markets for Observable Unobservable Fair Value
Identical Asset Inputs Inputs December 31,
Asset Class (Level 1) (Level 2) (Level 3) 2008 % of Total
Cash and Cash Equivalents $ 497 $ 367 $ — $ 864 12%
Equity Securities:
U.S. Large Cap 149 561 — 710 10%
U.S. Mid Cap 33 — — 33 — %
U.S. Small Cap 26 60 — 86 1%
International Developed 866 740 — 1,606 22%
Emerging Markets 89 84 — 173 2%
Global Equity 8 106 — 114 2%
Total Equity Securities $ 1,171 $ 1,551 $ — $ 2,722 37%
Debt Securities:
U.S. Treasury Securities 4 230 — 234 3%
Debt Security Issued by Government Agency 116 769 — 885 12%
Corporate Bonds 94 1,116 — 1,210 16%
Asset Backed Securities 1 338 — 339 5%
Total Debt Securities $ 215 $ 2,453 $ — $ 2,668 36%
Common/Collective Trust $ — $ 68 $ — $ 68 1%
Derivatives:
Interest Rate Contracts — 77 — 77 1%
Foreign Exchange Contracts — (81) — (81) (1)%
Equity Contracts — 114 — 114 2%
Credit Contracts — 3 — 3 — %
Other Contracts — 7 — 7 — %
Total Derivatives $ — $ 120 $ — $ 120 2%
Hedge Funds — — 3 3 — %
Real Estate 8 117 279 404 6%
Private Equity/Venture Capital — — 331 331 5%
Guaranteed Insurance Contracts — — 104 104 1%
Other 2 19 — 21 — %
Total Defined Benefit Plan’s Assets(1) $ 1,893 $ 4,695 $ 717 $ 7,305 100%
(1) Total fair value assets exclude $(382) of other net non-financial assets (liabilities) such as due to/from broker, interest receivables and accrued expenses.