Xerox 2009 Annual Report Download - page 37
Download and view the complete annual report
Please find page 37 of the 2009 Xerox annual report below. You can navigate through the pages in the report by either clicking on the pages listed below, or by using the keyword search tool below to find specific information within the annual report.-
 1
1 -
2
-
3
-
4
-
5
-
6
-
7
-
8
-
9
-
10
-
11
-
12
-
13
-
14
-
15
-
16
-
17
-
18
-
19
-
20
-
21
-
22
-
23
-
24
-
25
-
26
-
 27
27 -
 28
28 -
 29
29 -
 30
30 -
 31
31 -
 32
32 -
 33
33 -
 34
34 -
 35
35 -
 36
36 -
 37
37 -
 38
38 -
 39
39 -
 40
40 -
 41
41 -
 42
42 -
 43
43 -
 44
44 -
 45
45 -
 46
46 -
 47
47 -
48
-
49
-
50
-
51
-
52
-
53
-
54
-
55
-
56
-
57
-
58
-
59
-
60
-
61
-
62
-
63
-
64
-
65
-
66
-
67
-
68
-
69
-
70
-
71
-
72
-
73
-
74
-
75
-
76
-
77
-
78
-
79
-
80
-
81
-
82
-
83
-
84
-
85
-
86
-
87
-
88
-
89
-
90
-
91
-
92
-
93
-
94
-
95
-
96
 |
 |

35Xerox 2009 Annual Report
Management’s Discussion
•$139 million decrease due to higher restructuring payments related
to prior years’ actions.
•$54 million decrease due to lower accounts payable and accrued
compensation, primarily related to lower purchases and the timing
of payments to suppliers.
Net cash provided by operating activities was $939 million for the
year ended December 31, 2008. The $932 million decrease from
2007 was primarily due to the following:
•$615 million decrease due to net payments for the settlement of
the securities-related litigation.
•$330 million decrease in pre-tax income before litigation and
restructuring.
•$90 million decrease due to higher net income tax payments,
primarily resulting from the absence of prior-year tax refunds.
•$74 million decrease primarily due to lower benefit and
compensation accruals.
•$71 million decrease due to higher inventory levels as a result of
lower equipment and supplies sales in 2008.
•$136 million increase from accounts receivable due to strong
collection effectiveness throughout 2008.
•$107 million increase from derivatives, primarily due to the
termination of certain interest rate swaps in fourth quarter 2008.
CashFlowsfromOperatingActivities
Net cash provided by operating activities was $2,208 million for the
year ended December 31, 2009. The $1,269 million increase from
2008 was primarily due to the following:
•$587 million increase due to the absence of payments for securities-
related litigation settlements.
•$433 million increase as a result of lower inventory levels reflecting
aggressive supply chain actions in light of lower sales volume.
•$410 million increase from accounts receivables reflecting the
benefits from sales of accounts receivables, lower revenue and
strong collection effectiveness.
•$177 million increase due to lower contributions to our defined
pension benefit plans. The lower contributions are primarily in the
U.S., as no contributions were required due to the availability of
prior years’ credit balances.
•$116 million increase due to lower net tax payments.
•$84 million increase due to higher net run-off of finance receivables.
•$64 million increase due to lower placements of equipment on
operating leases, reflecting lower install activity.
•$440 million decrease in pre-tax income before litigation, restructuring
and acquisition costs.
Capital Resources and Liquidity
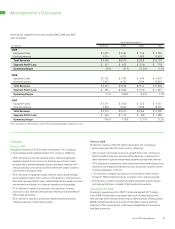
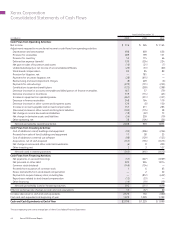
Cash Flow Analysis
The following summarizes our cash flows for the three years ended
December 31, 2009, as reported in our Consolidated Statements of
Cash Flows in the accompanying Consolidated Financial Statements:
Year Ended December 31, Change
(in millions) 2009 2008 2007 2009 2008
Net cash provided by operating activities $ 2,208 $ 939 $ 1,871 $ 1,269 $ (932)
Net cash used in investing activities (343) (441) (1,612) 98 1,171
Net cash provided by (used in) financing activities 692 (311) (619) 1,003 308
Effect of exchange rate changes on cash and cash equivalents 13 (57) 60 70 (117)
Increase (decrease) in cash and cash equivalents 2,570 130 (300) 2,440 430
Cash and cash equivalents at beginning of year 1,229 1,099 1,399 130 (300)
Cash and Cash Equivalents at End of Year $ 3,799 $ 1,229 $ 1,099 $ 2,570 $ 130