Xerox 2008 Annual Report Download - page 95
Download and view the complete annual report
Please find page 95 of the 2008 Xerox annual report below. You can navigate through the pages in the report by either clicking on the pages listed below, or by using the keyword search tool below to find specific information within the annual report.-
 1
1 -
2
-
3
-
4
-
5
-
6
-
7
-
8
-
9
-
10
-
11
-
12
-
13
-
14
-
15
-
16
-
17
-
18
-
19
-
20
-
21
-
22
-
23
-
24
-
25
-
26
-
27
-
28
-
29
-
30
-
31
-
32
-
33
-
34
-
35
-
36
-
37
-
38
-
39
-
40
-
41
-
42
-
43
-
44
-
45
-
46
-
47
-
48
-
49
-
50
-
51
-
52
-
53
-
54
-
55
-
56
-
57
-
58
-
59
-
60
-
61
-
62
-
63
-
64
-
65
-
66
-
67
-
68
-
69
-
70
-
71
-
72
-
73
-
74
-
75
-
76
-
77
-
78
-
79
-
80
-
81
-
82
-
83
-
84
-
 85
85 -
 86
86 -
 87
87 -
 88
88 -
 89
89 -
 90
90 -
 91
91 -
 92
92 -
 93
93 -
 94
94 -
 95
95 -
 96
96 -
 97
97 -
 98
98 -
 99
99 -
 100
100
 |
 |

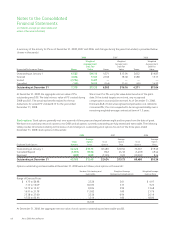
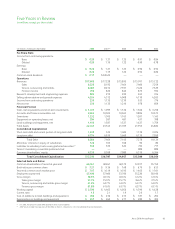
Five Years in Review
(in millions, except per share data)
(in millions, except per-share data) 2008 2007(2) 2006 2005 2004
Per-Share Data
Income from continuing operations
Basic $ 0.26 $ 1.21 $ 1.25 $ 0.91 $ 0.84
Diluted 0.26 1.19 1.22 0.90 0.78
Earnings
Basic $ 0.26 $ 1.21 $ 1.25 $ 0.96 $ 0.94
Diluted 0.26 1.19 1.22 0.94 0.86
Common stock dividends $ 0.17 $ 0.0425 — — —
Operations
Revenues $17,608 $ 17,228 $ 15,895 $ 15,701 $ 15,722
Sales 8,325 8,192 7,464 7,400 7,259
Service, outsourcing and rentals 8,485 8,214 7,591 7,426 7,529
Finance income 798 822 840 875 934
Research, development and engineering expenses 884 912 922 943 914
Selling, administrative and general expenses 4,534 4,312 4,008 4,110 4,203
Income from continuing operations 230 1,135 1,210 933 776
Net income 230 1,135 1,210 978 859
Financial Position
Cash, cash equivalents and short-term investments $ 1,229 $ 1,099 $ 1,536 $ 1,566 $ 3,218
Accounts and finance receivables, net 9,462 10,505 10,043 9,886 10,573
Inventories 1,232 1,305 1,163 1,201 1,143
Equipment on operating leases, net 594 587 481 431 398
Land, buildings and equipment, net 1,419 1,587 1,527 1,627 1,759
Total Assets 22,447 23,543 21,709 21,953 24,884
Consolidated Capitalization
Short-term debt and current portion of long-term debt 1,610 525 1,485 1,139 3,074
Long-term debt 6,774 6,939 5,660 6,139 7,050
Total Debt 8,384 7,464 7,145 7,278 10,124
Minorities’ interests in equity of subsidiaries 120 103 108 90 80
Liabilities to subsidiary trusts issuing preferred securities(1) 648 632 624 724 717
Series C mandatory convertible preferred stock —— — 889 889
Common shareholders’ equity 6,238 8,588 7,080 6,319 6,244
Total Consolidated Capitalization $15,390 $16,787 $14,957 $15,300 $18,054
Selected Data and Ratios
Common shareholders of record at year-end 46,541 48,261 40,372 53,017 55,152
Book value per common share $ 7.21 $ 9.36 $ 7.48 $ 6.79 $ 6.53
Year-end common stock market price $ 7.97 $ 16.19 $ 16.95 $ 14.65 $ 17.01
Employees at year-end 57,100 57,400 53,700 55,220 58,100
Gross margin 38.9% 40.3% 40.6% 41.2% 41.6%
Sales gross margin 33.7% 35.9% 35.7% 36.6% 37.4%
Service, outsourcing and rentals gross margin 41.9% 42.7% 43.0% 43.3% 43.0%
Finance gross margin 61.8% 61.6% 63.7% 62.7% 63.1%
Working capital $ 2,700 $ 4,463 $ 4,056 $ 4,390 $ 4,628
Current ratio 1.5 2.1 1.9 2.0 1.7
Cost of additions to land, buildings and equipment $ 206 $ 236 $ 215 $ 181 $ 204
Depreciation on buildings and equipment $ 257 $ 262 $ 277 $ 280 $ 305
(1) For 2005, the amount includes $98 reported in other current liabilities.
(2) 2007 results include the acquisition of GIS. Refer to Note 3 – Acquisitions in the Consolidated Financial Statements.
Xerox 2008 Annual Report 93