Xerox 2008 Annual Report Download - page 39
Download and view the complete annual report
Please find page 39 of the 2008 Xerox annual report below. You can navigate through the pages in the report by either clicking on the pages listed below, or by using the keyword search tool below to find specific information within the annual report.-
 1
1 -
2
-
3
-
4
-
5
-
6
-
7
-
8
-
9
-
10
-
11
-
12
-
13
-
14
-
15
-
16
-
17
-
18
-
19
-
20
-
21
-
22
-
23
-
24
-
25
-
26
-
27
-
28
-
 29
29 -
 30
30 -
 31
31 -
 32
32 -
 33
33 -
 34
34 -
 35
35 -
 36
36 -
 37
37 -
 38
38 -
 39
39 -
 40
40 -
 41
41 -
 42
42 -
 43
43 -
 44
44 -
 45
45 -
 46
46 -
 47
47 -
 48
48 -
 49
49 -
50
-
51
-
52
-
53
-
54
-
55
-
56
-
57
-
58
-
59
-
60
-
61
-
62
-
63
-
64
-
65
-
66
-
67
-
68
-
69
-
70
-
71
-
72
-
73
-
74
-
75
-
76
-
77
-
78
-
79
-
80
-
81
-
82
-
83
-
84
-
85
-
86
-
87
-
88
-
89
-
90
-
91
-
92
-
93
-
94
-
95
-
96
-
97
-
98
-
99
-
100
 |
 |

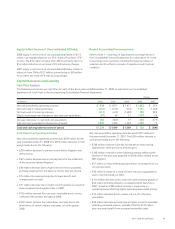
• R&D of $750 million decreased $14 million from 2007. Our R&D
• Sustaining engineering costs of $134 million were $14 million
• R,D&E as a percentage of revenue declined 0.3-percentage
support our GIS operations.
• R&D of $764 million increased $3 million from 2006. Our R&D is
• Sustaining engineering costs of $148 million were $13 million
• R,D&E as a percentage of revenue declined 0.5-percentage
GIS operations.
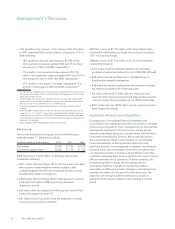
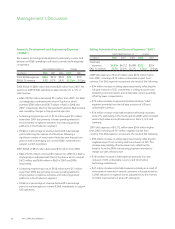
Total SAG
SAG % revenue
2008 SAG expenses of $4,534 million were $222 million higher
currency. The SAG expense increase was the result of the following:
• $94 million increase in selling expenses primarily reflecting the
full year inclusion of GIS, investments in selling resources and
• $75 million increase in general and administrative (“G&A”)
expenses primarily from the full year inclusion of GIS and
• $54 million increase in bad debt expense reflecting increased
write-offs, particularly in the fourth quarter 2008, which included
several high value account bankruptcies in the U.S., U.K. and
2007 SAG expenses of $4,312 million were $304 million higher
currency. The SAG expense increase was the result of the following:
• $93 million increase in selling expenses primarily reflecting the
negative impact from currency and the inclusion of GIS. This
• $164 million increase in G&A expenses primarily from the
inclusion of GIS, unfavorable currency and information
• $47 million increase in bad debt expense primarily as a result of
to reflect improvement in write-offs and aging.
36 Xerox 2008 Annual Report
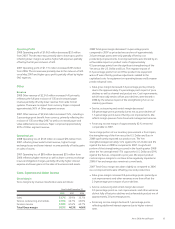
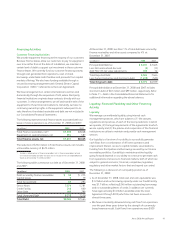
Bad debt expense included in SAG was $188 million, $134 million
and $87 million in 2008, 2007 and 2006, respectively. Bad debt
expense as a percent of total revenue increased in the fourth
quarter 2008 but was 1.1% in 2008 as compared to 0.8% and
0.5% for 2007 and 2006, respectively. Despite the fourth quarter
2008 increase in the provision and write-offs, days sales
outstanding at December 31, 2008 remained fairly flat year-over-
year and the aging of receivables as compared to historical levels
has not increased significantly. However, due to the current
economic conditions, there is an increased risk for our provision for
bad debts to trend higher in 2009 as compared to 2008. At
December 31, 2008, bad debt reserves, as a percentage of
receivables, were comparable to year end 2007.
Restructuring and Asset Impairment Charges
For the years ended December 31, 2008, 2007 and 2006 we
recorded net restructuring and asset impairment charges (credits)
of $429 million, $(6) million and $385 million, respectively. The
2008 net charge included $357 million related to headcount
reductions of approximately 4,900 employees primarily in North
America and Europe and lease termination and asset impairment
charges of $72 million primarily reflecting the exit from certain
leased and owned facilities resulting from a rationalization of our
worldwide operating locations. These actions applied equally to
both North America and Europe with approximately half focused
on SAG expense reductions, approximately a third on gross margin
improvements and the remainder focused on the optimization of
R,D&E investments. We expect to realize savings in 2009 of
approximately $250 million as a result of the 2008 restructuring
actions. Restructuring activity was minimal in 2007 and the related
credit of $6 million primarily reflected changes in estimates for
prior years’ severance costs. The 2006 net charge included $318
million related to headcount reductions of approximately 3,400
employees in North America and Europe, and lease termination
and asset impairment charges of $67 million primarily reflecting
the relocation of certain manufacturing operations and the exit
from certain leased and owned facilities. The restructuring reserve
balance as of December 31, 2008, for all programs was $352
million of which approximately $325 million is expected to be
spent over the next twelve months. Refer to Note 9 – Restructuring
and Asset Impairment Charges in the Consolidated Financial
Statements for further information regarding our restructuring
programs.
Worldwide Employment
Worldwide employment of 57,100 as of December 31, 2008
decreased approximately 300 from December 31, 2007, primarily
reflecting the reductions from restructuring partially offset by
additions as a result of 2008 acquisition activity. Worldwide
employment was approximately 57,400 and 53,700 at
December 31, 2007 and 2006, respectively.
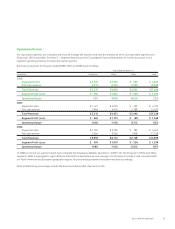
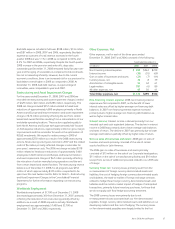
Other Expenses, Net
Other expenses, net for each of the three years ended
December 31, 2008, 2007 and 2006 consisted of the following:
Year Ended December 31,
(in millions) 2008 2007 2006
Non-financing interest expense $ 262 $263 $239
Interest income (35) (55) (69)
Gain on sales of businesses and assets (21) (7) (44)
Currency losses, net 34 8 39
Amortization of intangible assets 54 42 41
Legal matters 781 (6) 89
All other expenses, net 47 50 41
Total Other expenses, net $1,122 $295 $336
Non-financing interest expense: 2008 non-financing interest
expense was flat compared to 2007, as the benefit of lower
interest rates was offset by higher average non-financing debt
balances. In 2007 non-financing interest expense increased
primarily due to higher average non-financing debt balances as
well as higher interest rates.
Interest income: Interest income is derived primarily from our
invested cash and cash equivalent balances. The decline in interest
income in 2008 was primarily due to lower average cash balances
and rates of return. The decline in 2007 was primarily due to lower
average cash balances partially offset by higher rates of return.
Gain on sales of businesses and assets: 2008 gain on sales of
business and assets primarily consisted of the sale of certain
surplus facilities in Latin America.
The 2006 gain on sales of businesses and assets primarily
consisted of $15 million on the sale of our Corporate headquarters,
$11 million on the sale of a manufacturing facility and $10 million
receipt from escrow of additional proceeds related to our 2005 sale
of Integic.
Currency losses net: Currency losses primarily result from the
re-measurement of foreign currency-denominated assets and
liabilities, the cost of hedging foreign currency-denominated assets
and liabilities, the mark-to-market of foreign exchange contracts
utilized to hedge those foreign currency-denominated assets and
liabilities and the mark-to-market impact of hedges of anticipated
transactions, primarily future inventory purchases, for those that
we do not apply cash flow hedge accounting treatment.
The 2008 currency losses were primarily due to net
re-measurement losses associated with our Yen-denominated
payables, foreign currency denominated assets and liabilities in our
developing markets and the cost of hedging. The currency losses
on Yen-denominated payables were largely limited to the first
Xerox 2008 Annual Report 37