Xerox 2008 Annual Report Download - page 37
Download and view the complete annual report
Please find page 37 of the 2008 Xerox annual report below. You can navigate through the pages in the report by either clicking on the pages listed below, or by using the keyword search tool below to find specific information within the annual report.-
 1
1 -
2
-
3
-
4
-
5
-
6
-
7
-
8
-
9
-
10
-
11
-
12
-
13
-
14
-
15
-
16
-
17
-
18
-
19
-
20
-
21
-
22
-
23
-
24
-
25
-
26
-
 27
27 -
 28
28 -
 29
29 -
 30
30 -
 31
31 -
 32
32 -
 33
33 -
 34
34 -
 35
35 -
 36
36 -
 37
37 -
 38
38 -
 39
39 -
 40
40 -
 41
41 -
 42
42 -
 43
43 -
 44
44 -
 45
45 -
 46
46 -
 47
47 -
48
-
49
-
50
-
51
-
52
-
53
-
54
-
55
-
56
-
57
-
58
-
59
-
60
-
61
-
62
-
63
-
64
-
65
-
66
-
67
-
68
-
69
-
70
-
71
-
72
-
73
-
74
-
75
-
76
-
77
-
78
-
79
-
80
-
81
-
82
-
83
-
84
-
85
-
86
-
87
-
88
-
89
-
90
-
91
-
92
-
93
-
94
-
95
-
96
-
97
-
98
-
99
-
100
 |
 |

• 2% increase in post sale revenue as growth from color,
continuous feed and light production products offset declines in
revenue from black-and-white high-volume printing systems and
light lens devices.
• 10% decrease in equipment sales revenue, primarily reflecting
pricing declines in both black-and-white and color production
systems, driven in part by weakness in the U.S.
• 1% increase in installs of production color products driven in
activity as well as color
continuous feed.
• 6% decline in installs of production black-and-white systems
driven primarily by declines in installs of light production
systems.
• 8% increase in post sale and other revenue, including a
4-percentage point benefit from currency, as growth from digital
products more than offset declines in revenue from older light
lens technology.
• 1% decrease in equipment sales revenue, including a
3-percentage point benefit from currency, reflecting growth in
production color systems offset by declines in black-and-white
production printing systems and light production and an
increased proportion of equipment installed under operating
lease contracts where revenue is recognized over-time in post
sale.
• 6% growth in installs of production color products driven by
242/252/260 family, DocuColor 5000 and iGen3
activity.
• 8% decline in installs of production black-and-white systems
reflecting declines in installs of both high-volume and light
production systems.
2008 Operating profit of $394 million decreased $168 million from
2007. The decrease is primarily the result of lower revenue and
lower gross margins due to pricing and product mix as well as
increased SAG expenses.
2007 Operating profit of $562 million increased $58 million from
2006. The increase is primarily the result of higher gross profit and
lower R,D&E, partially offset by an increase in bad debt expense.
1-percentage point benefit from currency, as well as the benefits
from our expansion in the SMB market through GIS and Veenman.
Revenue for 2008 reflects:
• 4% increase in post sale revenue, reflecting the full year
inclusion of GIS as well as growth from color multifunction
black-and-white digital devices. Office post sale revenue was
negatively impacted in the fourth quarter of 2008 by declines in
channel supply purchases, including lower purchases within
developing markets.
• 2% increase in equipment sales revenue, reflecting the full year
inclusion of GIS as well as growth from color digital products
which more than offset declines from black-and-white devices
primarily due to price declines and product mix.
• 24% color multifunction device install growth led by strong
and Phaser products.
• 8% increase in installs of black-and-white copiers and
multifunction devices, including 8% growth in Segment 1&2
products (11-30 ppm) and 8% growth in Segment 3-5 products
(31-90 ppm). Segment 3-5 installs include the Xerox 4595, a 95
ppm device with an embedded controller.
• 12% increase in color printer installs.
• 9% increase in post sale revenue, reflecting the inclusion of GIS
since May 2007 as well as growth from color multifunction
devices and color printers.
• 9% increase in equipment sales revenue, reflecting the inclusion
of GIS since May 2007 as well as color multifunction products
install growth.
• 65% color multifunction device install growth led by strong
demand for Xerox WorkCentre products.
• 5% increase in installs of black-and-white copiers and
multifunction devices, including 4% growth in Segment 1&2
products (11-30 ppm) and 7% growth in Segment 3-5 products
(31-90 ppm) that includes the 95 ppm device with an embedded
controller.
• 10% decline in color printer installs due to lower OEM sales.
34 Xerox 2008 Annual Report
Operating Profit
2008 Operating profit of $1,062 million decreased $53 million
from 2007. The decrease was primarily due to lower gross profits
reflecting lower margins as well as higher SAG expenses partially
offset by the full year inclusion of GIS.
2007 Operating profit of $1,115 million increased $105 million
from 2006. The increase was primarily due to the inclusion of GIS
since May 2007 and higher gross profits partially offset by higher
SAG expenses.
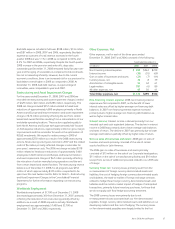
Other
Revenue
2008 Other revenue of $2,543 million increased 4% primarily
reflecting the full year inclusion of GIS and increased paper
revenue partially offset by lower revenue from wide format
systems. There was no impact from currency. Paper comprised
approximately 50% of Other segment revenue.
2007 Other revenue of $2,440 million increased 15%, including a
3-percentage point benefit from currency, primarily reflecting the
inclusion of GIS since May 2007 as well as increased paper and
value-added services revenues. Paper comprised approximately
50% of Other segment revenue.
Operating Loss
2008 Operating loss of $165 million increased $76 million from
2007 reflecting lower wide format revenue, higher foreign
exchange losses and lower interest income partially offset by gains
on sales of assets.
2007 Operating loss of $89 million decreased $35 million from
2006 reflecting higher revenue as well as lower currency exchange
losses and litigation charges, partially offset by higher interest
expense and lower gains on the sales of businesses and assets.
Costs, Expenses and Other Income
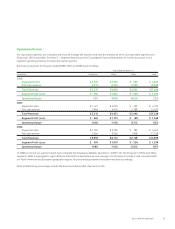
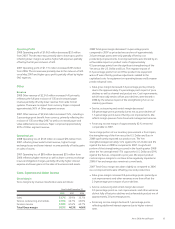
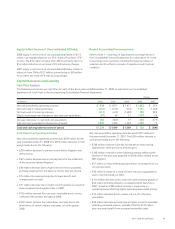
Gross Margin
Gross margins by revenue classification were as follows:
Year Ended December 31,
2008 2007 2006
Sales 33.7% 35.9% 35.7%
Service, outsourcing and rentals 41.9% 42.7% 43.0%
Finance income 61.8% 61.6% 63.7%
Total Gross margin 38.9% 40.3% 40.6%
2008 Total gross margin decreased 1.4-percentage points
compared to 2007 as price declines and mix of approximately
2.0-percentage points were only partially offset by cost
productivity improvements. Cost improvements were limited by an
unfavorable impact on product costs of approximately
0.5-percentage points from the significant strengthening of the
Yen versus the U.S. Dollar and Euro. The negative impact of
0.3-percentage points from an Office product line equipment
write-off was offset by positive adjustments related to the
capitalized costs for equipment on operating leases and European
product disposal costs.
• Sales gross margin decreased 2.2-percentage points primarily
due to the approximately 2.5-percentage point impact of price
declines as well as channel and product mix. Cost improvements,
which historically tend to offset price declines, were limited in
2008 by the adverse impact of the strengthening Yen on our
inventory purchases.
• Service, outsourcing and rentals margin decreased
0.8-percentage points primarily due to mix as price declines of
1.3-percentage points were offset by cost improvements. Mix
reflects margin pressure from document management services.
• Financing income margin of approximately 62% remained
comparable to 2007.
Since a large portion of our inventory procurement is from Japan,
the strengthening of the Yen versus the U.S. Dollar and Euro in
2008 significantly impacted our product cost. The Yen
strengthened approximately 14% against the U.S. Dollar and 6%
against the Euro in 2008 as compared to 2007. A significant
portion of that strengthening occurred in the fourth quarter 2008
when the Yen strengthened 17% against the U.S. Dollar and 29%
against the Euro as compared to prior year. We expect product
costs and gross margins to continue to be negatively impacted in
2009 if Yen exchange rates remain at current levels.
2007 Total Gross margin was down slightly as compared to 2006
as cost improvements were offset by price and product mix.
• Sales gross margin increased 0.2-percentage points primarily as
cost improvements and other variances more than offset the
2.0-percentage point impact of price declines.
• Service, outsourcing and rentals margin decreased
0.3-percentage points as cost improvements and other variances
did not fully offset price declines and unfavorable product mix of
approximately 2.0-percentage points.
• Financing income margin declined 2.1-percentage points
reflecting additional interest expense due to higher interest
rates.
Xerox 2008 Annual Report 35