Xerox 2008 Annual Report Download - page 35
Download and view the complete annual report
Please find page 35 of the 2008 Xerox annual report below. You can navigate through the pages in the report by either clicking on the pages listed below, or by using the keyword search tool below to find specific information within the annual report.-
 1
1 -
2
-
3
-
4
-
5
-
6
-
7
-
8
-
9
-
10
-
11
-
12
-
13
-
14
-
15
-
16
-
17
-
18
-
19
-
20
-
21
-
22
-
23
-
24
-
 25
25 -
 26
26 -
 27
27 -
 28
28 -
 29
29 -
 30
30 -
 31
31 -
 32
32 -
 33
33 -
 34
34 -
 35
35 -
 36
36 -
 37
37 -
 38
38 -
 39
39 -
 40
40 -
 41
41 -
 42
42 -
 43
43 -
 44
44 -
 45
45 -
46
-
47
-
48
-
49
-
50
-
51
-
52
-
53
-
54
-
55
-
56
-
57
-
58
-
59
-
60
-
61
-
62
-
63
-
64
-
65
-
66
-
67
-
68
-
69
-
70
-
71
-
72
-
73
-
74
-
75
-
76
-
77
-
78
-
79
-
80
-
81
-
82
-
83
-
84
-
85
-
86
-
87
-
88
-
89
-
90
-
91
-
92
-
93
-
94
-
95
-
96
-
97
-
98
-
99
-
100
 |
 |

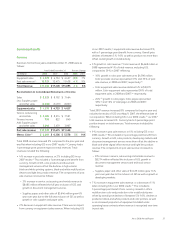
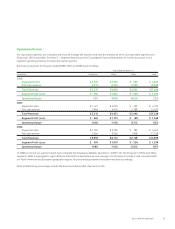
Operations Review
Our reportable segments are consistent with how we manage the business and view the markets we serve. Our reportable segments are
Production, Office and Other. See Note 2 – Segment Reporting in the Consolidated Financial Statements for further discussion on our
segment operating revenues and segment operating profit.
Revenues by segment for the years ended 2008, 2007 and 2006 were as follows:
Year Ended December 31,
(in millions) Production Office Other Total
2008
Equipment sales $1,325 $3,105 $ 249 $ 4,679
Post sale revenue 3,912 6,723 2,294 12,929
Total Revenues $5,237 $9,828 $ 2,543 $17,608
Segment Profit (Loss) $ 394 $1,062 $ (165) $ 1,291
Operating Margin 7.5% 10.8% (6.5)% 7.3%
2007
Equipment sales $ 1,471 $ 3,030 $ 252 $ 4,753
Post sale revenue 3,844 6,443 2,188 12,475
Total Revenues $5,315 $9,473 $ 2,440 $17,228
Segment Profit (Loss) $ 562 $1,115 $ (89) $ 1,588
Operating Margin 10.6% 11.8% (3.7)% 9.2%
2006
Equipment sales $ 1,491 $ 2,786 $ 180 $ 4,457
Post sale revenue 3,564 5,926 1,948 11,438
Total Revenues $5,055 $8,712 $ 2,128 $15,895
Segment Profit (Loss) $ 504 $1,010 $ (124) $ 1,390
Operating Margin 10.0% 11.6% (5.8)% 8.7%
In 2008 we revised our segment reporting to integrate the Developing Markets Operations (“DMO”) into the Production, Office and Other
segments. DMO is a geographic region that has matured to a level where we now manage it on the basis of products sold, consistent with
our North American and European geographic regions. All prior periods presented have been restated accordingly.
Note: Install activity percentages include the Xerox-branded product shipments to GIS.
Xerox 2008 Annual Report 33