Xerox 2008 Annual Report Download - page 77
Download and view the complete annual report
Please find page 77 of the 2008 Xerox annual report below. You can navigate through the pages in the report by either clicking on the pages listed below, or by using the keyword search tool below to find specific information within the annual report.-
 1
1 -
2
-
3
-
4
-
5
-
6
-
7
-
8
-
9
-
10
-
11
-
12
-
13
-
14
-
15
-
16
-
17
-
18
-
19
-
20
-
21
-
22
-
23
-
24
-
25
-
26
-
27
-
28
-
29
-
30
-
31
-
32
-
33
-
34
-
35
-
36
-
37
-
38
-
39
-
40
-
41
-
42
-
43
-
44
-
45
-
46
-
47
-
48
-
49
-
50
-
51
-
52
-
53
-
54
-
55
-
56
-
57
-
58
-
59
-
60
-
61
-
62
-
63
-
64
-
65
-
66
-
 67
67 -
 68
68 -
 69
69 -
 70
70 -
 71
71 -
 72
72 -
 73
73 -
 74
74 -
 75
75 -
 76
76 -
 77
77 -
 78
78 -
 79
79 -
 80
80 -
 81
81 -
 82
82 -
 83
83 -
 84
84 -
 85
85 -
 86
86 -
 87
87 -
88
-
89
-
90
-
91
-
92
-
93
-
94
-
95
-
96
-
97
-
98
-
99
-
100
 |
 |

Notes to the Consolidated
Financial Statements
(in millions, except per share data and
unless otherwise indicated)
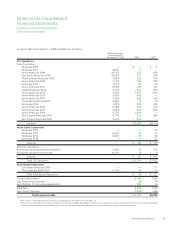
Non Designated Derivatives for the Years Ended December 31, 2008 and 2007
Derivatives Not designated as hedging instruments Location of Derivative Gain (Loss) 2008 2007
Foreign exchange contracts – forwards Other expense $(143) $(10)
Foreign exchange contracts – options Other expense (4) 3
Total Non Designated Derivatives $(147) $ (7)
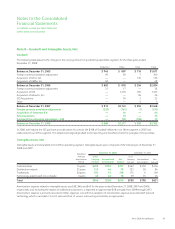
Accumulated Other Comprehensive Loss (“AOCL”)
The following table provides a summary of the activity associated
with all of our designated cash flow hedges (interest rate and
foreign currency) reflected in AOCL for the three years ended
December 31, 2008):
Year Ended December 31,
2008 2007 2006
Beginning balance, net of tax $— $ 1 $1
Changes in fair value gain (loss) 14 (1)
Reclass to earnings (1) (5) 1
Ending balance, net of tax $— $— $1
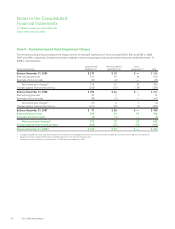
Fair Value of Financial Assets and Liabilities
As discussed in Note 1 – Summary of Significant Accounting
Policies, we adopted FAS 157 on January 1, 2008, which among
other things, requires enhanced disclosures about assets and
liabilities measured at fair value on a recurring basis. Our adoption
of FAS 157 was limited to financial assets and liabilities, which
primarily relate to our derivative contracts.
FAS 157 includes a fair value hierarchy that is intended to increase
consistency and comparability in fair value measurements and
related disclosures. The fair value hierarchy is based on inputs to
valuation techniques that are used to measure fair value that are
either observable or unobservable. Observable inputs reflect
assumptions market participants would use in pricing an asset or
liability based on market data obtained from independent sources
while unobservable inputs reflect a reporting entity’s pricing based
upon their own market assumptions.
The fair value hierarchy consists of the following three levels:
• Level 1 – Inputs are quoted prices in active markets for identical
assets or liabilities.
• Level 2 – Inputs are quoted prices for similar assets or liabilities
in an active market, quoted prices for identical or similar assets
or liabilities in markets that are not active, inputs other than
quoted prices that are observable and market-corroborated
inputs which are derived principally from or corroborated by
observable market data.
• Level 3 – Inputs are derived from valuation techniques in which
one or more significant inputs or value drivers are unobservable.
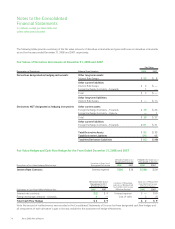
The following table represents our assets and liabilities measured
at fair value on a recurring basis as of December 31, 2008 and the
basis for that measurement:
Total
Fair Value
Measurement
December 31,
2008
Quoted Prices
in Active
Markets for
Identical Asset
(Level 1)
Significant
Other
Observable
Inputs
(Level 2)
Significant
Unobservable
Inputs
(Level 3)
Derivative
Assets $ 92 $— $ 92 $—
Derivative
Liabilities $134 $— $134 $—
We utilize the income approach to measure fair value for our
derivative assets and liabilities. The income approach uses pricing
models that rely on market observable inputs such as yield curves,
currency exchange rates and forward prices, and therefore are
classified as Level 2.
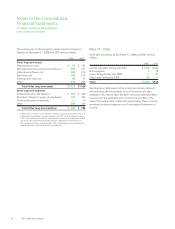
The estimated fair values of our other financial assets and
liabilities not measured at fair value on a recurring basis at
December 31, 2008 and 2007 were as follows:
2008 2007
Carrying
Amount Fair
Value Carrying
Amount Fair
Value
Cash and cash equivalents $1,229 $1,229 $1,099 $1,099
Accounts receivable, net 2,184 2,184 2,457 2,457
Short-term debt 1,610 1,593 525 525
Long-term debt 6,774 5,918 6,939 7,176
Liability to subsidiary trust
issuing preferred securities 648 555 632 632
The fair value amounts for Cash and cash equivalents and
Accounts receivable, net approximate carrying amounts due to the
short maturities of these instruments. The fair value of Short and
Long-term debt, as well as our Liability to subsidiary trust issuing
preferred securities, was estimated based on quoted market prices
for publicly traded securities or on the current rates offered to us
for debt of similar maturities. The difference between the fair value
and the carrying value represents the theoretical net premium or
discount we would pay or receive to retire all debt at such date.
Xerox 2008 Annual Report 75