Xerox 2008 Annual Report Download - page 76
Download and view the complete annual report
Please find page 76 of the 2008 Xerox annual report below. You can navigate through the pages in the report by either clicking on the pages listed below, or by using the keyword search tool below to find specific information within the annual report.-
 1
1 -
2
-
3
-
4
-
5
-
6
-
7
-
8
-
9
-
10
-
11
-
12
-
13
-
14
-
15
-
16
-
17
-
18
-
19
-
20
-
21
-
22
-
23
-
24
-
25
-
26
-
27
-
28
-
29
-
30
-
31
-
32
-
33
-
34
-
35
-
36
-
37
-
38
-
39
-
40
-
41
-
42
-
43
-
44
-
45
-
46
-
47
-
48
-
49
-
50
-
51
-
52
-
53
-
54
-
55
-
56
-
57
-
58
-
59
-
60
-
61
-
62
-
63
-
64
-
65
-
 66
66 -
 67
67 -
 68
68 -
 69
69 -
 70
70 -
 71
71 -
 72
72 -
 73
73 -
 74
74 -
 75
75 -
 76
76 -
 77
77 -
 78
78 -
 79
79 -
 80
80 -
 81
81 -
 82
82 -
 83
83 -
 84
84 -
 85
85 -
 86
86 -
87
-
88
-
89
-
90
-
91
-
92
-
93
-
94
-
95
-
96
-
97
-
98
-
99
-
100
 |
 |
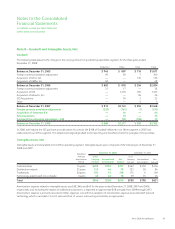
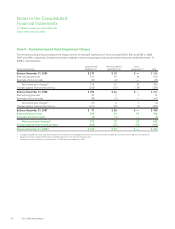
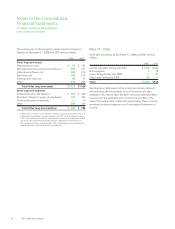
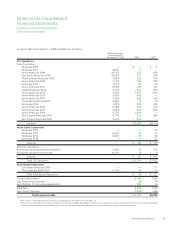
Notes to the Consolidated
Financial Statements
(in millions, except per share data and
unless otherwise indicated)
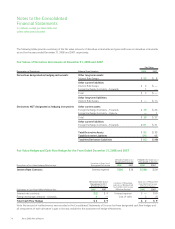
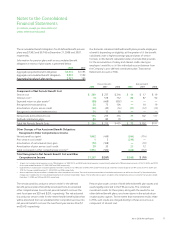
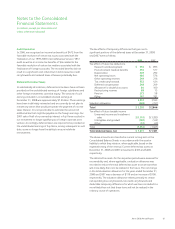
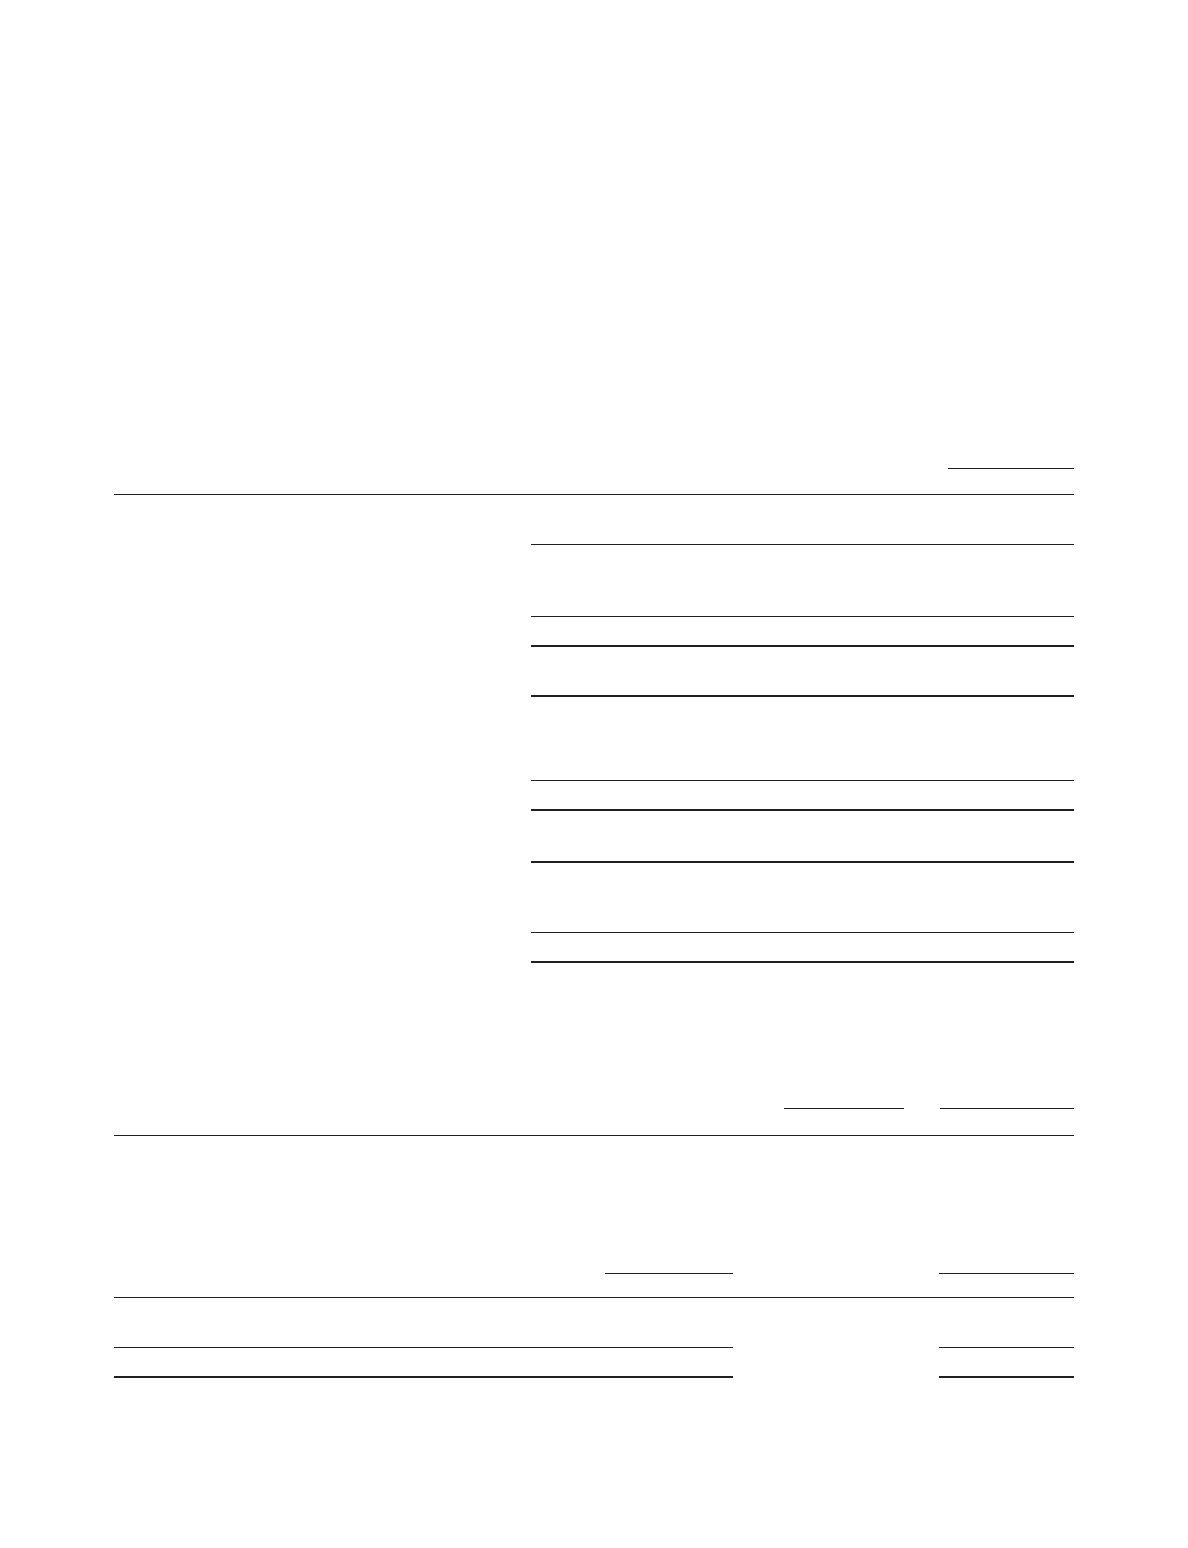
The following tables provide a summary of the fair value amounts of derivative instruments and gains and losses on derivative instruments
at and for the years ended December 31, 2008 and 2007, respectively.
Fair Values of Derivative Instruments at December 31, 2008 and 2007
Fair Value
Designation of Derivatives Balance Sheet Location 2008 2007
Derivatives designated as hedging instruments Other long-term assets:
Interest Rate Swaps $ 53 $8
Other current liabilities:
Interest Rate Swaps $2 $—
Foreign Exchange Contracts – Forwards 1—
Total $3 $—
Other long-term liabilities:
Interest Rate Swaps $— $ 14
Derivatives NOT designated as hedging instruments Other current assets:
Foreign Exchange Contracts – Forwards $ 39 $ 26
Foreign Exchange Contracts – Options —1
Total $ 39 $ 27
Other current liabilities:
Foreign Exchange Contracts – Forwards $131 $ 31
Total Derivative Assets $ 92 $ 35
Total Derivative Liabilities 134 45
Total Net Derivative Liabilities $ (42) $(10)
Fair Value Hedges and Cash Flow Hedges for the Years Ended December 31, 2008 and 2007
Location of Gain (Loss)
Recognized In Income
Derivative Gain (Loss)
Recognized in Income Hedged Item Gain (Loss)
Recognized in Income
Derivatives in Fair Value Hedging Relationships 2008 2007 2008 2007
Interest Rate Contracts Interest expense $206 $36 $(206) $(36)
Derivative Gain (Loss)
Recognized in OCI
(Effective Portion)
Location of Derivative
Gain (Loss) Reclassified
from AOCI into Income
(Effective Portion)
Gain (Loss) Reclassified
from AOCI to Income
(Effective Portion)
Derivatives in Cash Flow Hedging Relationships 2008 2007 2008 2007
Interest rate contracts $(2) $ 9 Interest expense $— $10
Foreign exchange contracts – forwards 4— Cost of sales 2(1)
Total Cash Flow Hedges $ 2 $ 9 $ 2 $ 9
Note: No amount of ineffectiveness was recorded in the Consolidated Statements of Income for these designated cash flow hedges and
all components of each derivative’s gain or loss was included in the assessment of hedge effectiveness.
74 Xerox 2008 Annual Report
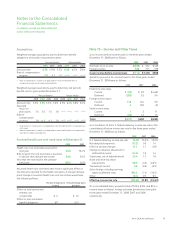
• Level 1 – Inputs are quoted prices in active markets for identical
• Level 2 – Inputs are quoted prices for similar assets or liabilities
• Level 3 – Inputs are derived from valuation techniques in which
Identical Asset Inputs