Xerox 2008 Annual Report Download - page 28
Download and view the complete annual report
Please find page 28 of the 2008 Xerox annual report below. You can navigate through the pages in the report by either clicking on the pages listed below, or by using the keyword search tool below to find specific information within the annual report.-
 1
1 -
2
-
3
-
4
-
5
-
6
-
7
-
8
-
9
-
10
-
11
-
12
-
13
-
14
-
15
-
16
-
17
-
 18
18 -
 19
19 -
 20
20 -
 21
21 -
 22
22 -
 23
23 -
 24
24 -
 25
25 -
 26
26 -
 27
27 -
 28
28 -
 29
29 -
 30
30 -
 31
31 -
 32
32 -
 33
33 -
 34
34 -
 35
35 -
 36
36 -
 37
37 -
 38
38 -
39
-
40
-
41
-
42
-
43
-
44
-
45
-
46
-
47
-
48
-
49
-
50
-
51
-
52
-
53
-
54
-
55
-
56
-
57
-
58
-
59
-
60
-
61
-
62
-
63
-
64
-
65
-
66
-
67
-
68
-
69
-
70
-
71
-
72
-
73
-
74
-
75
-
76
-
77
-
78
-
79
-
80
-
81
-
82
-
83
-
84
-
85
-
86
-
87
-
88
-
89
-
90
-
91
-
92
-
93
-
94
-
95
-
96
-
97
-
98
-
99
-
100
 |
 |

Management’s Discussion
2008 total gross margin of 38.9% was 1.4-percentage points
below the prior year. Pricing, product mix and unfavorable
exchange rates on our Yen based inventory purchases were only
partially offset by cost productivity improvements. Selling,
administrative and general (“SAG”) expenses as a percent of
revenue were 25.7 percent or 0.7-percentage points higher than
the prior year. SAG expenses increased due to the full year inclusion
of GIS, higher bad debt provisions and increased marketing
investments partially offset by restructuring savings. Additionally,
we continued to invest in research and development and to
prioritize our investments in the faster growing areas of the market.
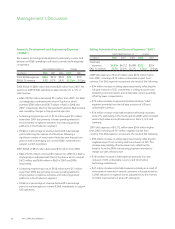
Research, development and engineering (“RD&E”) expenses were
5% of revenue in 2008, which is consistent with the prior year. Our
investments in the growing areas of digital production and office
systems, particularly with respect to color products, contributed to
more than two-thirds of our equipment sales being generated from
products launched in the last two years.
Changes in our revenue mix – both from geographic and product
line perspectives – have reduced our gross profit margins. This,
combined with uncertain economic conditions, required us to take
actions to adjust our cost and expense profile. Accordingly, we
recognized pre-tax restructuring charges of $429 million for 2008
actions in order to reduce our cost base and provide increased
flexibility in our business in this depressed or recessionary
economy. Refer to Note 9 – Restructuring and Asset Impairment
Charges in the Consolidated Financial Statements for further
information.
Our balance sheet strategy focused on optimizing operating cash
flows and returning value to shareholders through acquisitions,
share repurchase and dividends. We continue to maintain debt
levels primarily to support our customer financing operations. Cash
flow from operations was $939 million in 2008 and included $615
million of net securities-related litigation payments as we resolved
two long standing securities litigation cases. Cash used for
investments was $441 million and included capital expenditures of
$335 million and acquisitions of $155 million. Cash used for
financing of $311 million reflected continued net repayments of
secured borrowings of $227 million; $812 million for share
repurchases; and $154 million for dividends, partially offset by net
cash flows from new borrowings of $926 million. New borrowings
included $1.4 billion of Senior Notes in an April 2008 public
offering. We finished the year with cash and cash equivalents of
$1.2 billion.
Our prospective balance sheet strategy includes: optimizing
operating cash flows; maintaining our investment grade credit
ratings; achieving an optimal cost of capital; and effectively
deploying cash to deliver and maximize long-term shareholder
value through acquisitions, share repurchase and dividends.
However, due to the current economic uncertainty, we have no
immediate plans for further share repurchases at this time. Our
strategy also includes appropriately leveraging our financing assets
(finance receivables and equipment on operating leases).
Currency Impacts
To understand the trends in our business, we believe that it is
helpful to analyze the impact of changes in the translation of
foreign currencies into U.S. Dollars on revenues and expenses. We
refer to this analysis as “currency impact” or “the impact from
currency”. Revenues and expenses from our developing markets are
analyzed at actual exchange rates for all periods presented, since
these countries generally have volatile currency and inflationary
environments, and our operations in these countries have
historically implemented pricing actions to recover the impact of
inflation and devaluation. We do not hedge the translation effect
of revenues or expenses denominated in currencies where the local
currency is the functional currency.
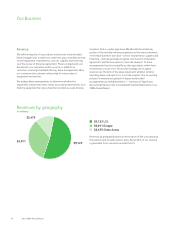
Approximately 50% of our consolidated revenues are derived from
operations outside of the United States where the U.S. Dollar is not
the functional currency. When compared with the average of the
major European currencies and Canadian Dollar on a revenue-
weighted basis, the U.S. Dollar was 3% weaker in 2008 and 9%
weaker in 2007, each compared to the prior year. As a result, the
foreign currency translation impact on revenue was a 1% benefit
in 2008 and a 3% benefit in 2007.
Currency exchange rates fluctuated significantly in the fourth
quarter 2008. The U.S. Dollar strengthened significantly in the
fourth quarter 2008 as compared to the currencies of our major
foreign operations – the Euro, Pound Sterling and Canadian Dollar.
The foreign currency translation impact on revenue from this
fluctuation in exchange rates was a 3% point benefit through the
third quarter 2008 as compared to a 5% detriment in the fourth
quarter 2008. If U.S. Dollar exchange rates against these major
currencies remain at their current levels we expect it will have an
estimated 5% to 6% negative impact on total revenue in the first
half of 2009.
26 Xerox 2008 Annual Report
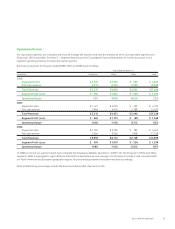
• 4% increase in post sale revenue, or 2% including GIS in our
• 2% decrease in equipment sales revenue. There was no impact
• 5% growth in color revenue.
• 9% increase in post sale revenue, or 6% including GIS in our
• 7% increase in equipment sales revenue, or a decrease of 1%