Xerox 2008 Annual Report Download - page 9
Download and view the complete annual report
Please find page 9 of the 2008 Xerox annual report below. You can navigate through the pages in the report by either clicking on the pages listed below, or by using the keyword search tool below to find specific information within the annual report.-
 1
1 -
 2
2 -
 3
3 -
 4
4 -
 5
5 -
 6
6 -
 7
7 -
 8
8 -
 9
9 -
 10
10 -
 11
11 -
 12
12 -
 13
13 -
 14
14 -
 15
15 -
 16
16 -
 17
17 -
 18
18 -
 19
19 -
 20
20 -
21
-
22
-
23
-
24
-
25
-
26
-
27
-
28
-
29
-
30
-
31
-
32
-
33
-
34
-
35
-
36
-
37
-
38
-
39
-
40
-
41
-
42
-
43
-
44
-
45
-
46
-
47
-
48
-
49
-
50
-
51
-
52
-
53
-
54
-
55
-
56
-
57
-
58
-
59
-
60
-
61
-
62
-
63
-
64
-
65
-
66
-
67
-
68
-
69
-
70
-
71
-
72
-
73
-
74
-
75
-
76
-
77
-
78
-
79
-
80
-
81
-
82
-
83
-
84
-
85
-
86
-
87
-
88
-
89
-
90
-
91
-
92
-
93
-
94
-
95
-
96
-
97
-
98
-
99
-
100
 |
 |

7Xerox 2008 Annual Report
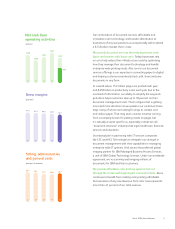
Our distribution and services capacity is also the best and
broadest in our industry. Through our vast and growing
network of direct sales, agents, resellers, Global Imaging
partners and distributors, we do business in over 160 countries.
This is a huge competitive advantage, as customers depend
on us for global account management and increasingly
want to move documents around the world with speed, ease
and security.
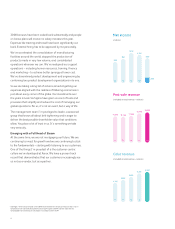
Our strategic bets in the marketplace are paying off in
areas like color and document services. Color pages now
represent 18 percent of total pages printed on Xerox
technology, up from 12 percent in 2007. We lead the industry
in the number of color pages printed. In services, we generated
$3.5 billion in annuity revenue last year, a year-over-year
increase of 3 percent.
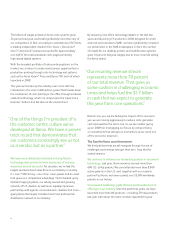
Our recurring revenue stream represents more than 70
percent of our total revenue. That gives us some cushion
in challenging economic times and helps fuel the $1.7 billion
in cash that we expect to generate this year from core
operations.
Our leadership team is battle-tested and results-driven.
They are an unusual mix of Xerox veterans, new leaders who
have recently emerged from the ranks and people who joined
us from other leading companies. They are all driven by one
goal – the success of Xerox measured by the value we deliver
to our shareholders.
Last but hardly least is the quality and dedication of our
workforce. Together with our technology and our distribution,
they provide the knowledge and the passion to bring value to
our customers. When I visit customers, it’s our people they
want to talk about. Customers sing the praises of Xerox people
and want to talk about their focus on solving problems, their
can-do attitude, and their desire to do whatever it takes to get
the job done. At the end of the day, Xerox people spell the
difference between failure and success.
So we are feeling good about where we are. There is a fair
amount of disruption in our industry – some of it brought on
by the economy but much of it brought on by Xerox. Over the
past few years, we have upped the ante considerably on the
technology we have brought to market. We have both built
and acquired new document services offerings. And we have
expanded our distribution.
We are proud of but not content with the competitive
advantage we have created in our industry. We know it’s a
never-ending battle but it’s one we’re eager to wage. We feel
the same way about corporate responsibility. Even in the worst
of times, we continue to make appropriate investments in
the communities in which we work and live. We continue to
be a leader in diversity in all its forms. We continue to fight
for a sustainable world and a greener planet.
We don’t have our heads in the sand about the challenges
we face, yet we believe we are better positioned than most
to meet the obstacles that 2009 will certainly bring our way.
There are likely to be winners and losers when the dust finally
settles. We feel confident we will be a winner.
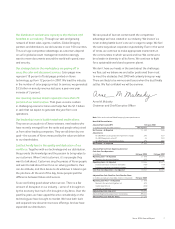
Anne M. Mulcahy
Chairman and Chief Executive Officer
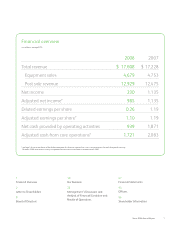
Adjusted Net Income/EPS Full-year 2008
(in millions, except per share amounts) Net Income EPS
Net Income – As Reported $ 230 0.26
Adjustments:
Q4 2008 Restructuring and asset impairment charges 240 0.27
Q4 2008 Equipment write-off 24 0.03
Q1 2008 Provision for litigation matters 491 0.54
Net Income – As Adjusted $ 985 1.10
Adjusted Net Cash from Operating Activities/
Cash from Core Operations
(in millions) Full-year 2008 Full-year 2007
Operating Cash – As Reported $ 939 $ 1,871
Payments for securities litigation 615 —
Operating Cash – As Adjusted $ 1,554 $ 1,871
Increase (decrease) in finance receivables (164) (119)
Increase in equipment on operating leases 331 331
Cash from Core Operations – As Adjusted $ 1,721 $ 2,083
Adjusted Free Cash Flow/Free Cash Flow Per Share
(in millions, except per-share data, shares in thousands) Full-year 2008
Operating Cash Flow – As Reported $ 939
Payments for securities litigation, net 615
Capital expenditures (206)
Internal-use software (129)
Adjusted Free Cash Flow (FCF) $ 1,219
Adjusted Weighted Average Shares Outstanding 895,542
Adjusted Free Cash Flow Per Share $ 1.36
Note: Color results exclude Global Imaging Systems performance.
Non-GAAP Reconciliation