Xerox 2008 Annual Report Download - page 38
Download and view the complete annual report
Please find page 38 of the 2008 Xerox annual report below. You can navigate through the pages in the report by either clicking on the pages listed below, or by using the keyword search tool below to find specific information within the annual report.-
 1
1 -
2
-
3
-
4
-
5
-
6
-
7
-
8
-
9
-
10
-
11
-
12
-
13
-
14
-
15
-
16
-
17
-
18
-
19
-
20
-
21
-
22
-
23
-
24
-
25
-
26
-
27
-
 28
28 -
 29
29 -
 30
30 -
 31
31 -
 32
32 -
 33
33 -
 34
34 -
 35
35 -
 36
36 -
 37
37 -
 38
38 -
 39
39 -
 40
40 -
 41
41 -
 42
42 -
 43
43 -
 44
44 -
 45
45 -
 46
46 -
 47
47 -
 48
48 -
49
-
50
-
51
-
52
-
53
-
54
-
55
-
56
-
57
-
58
-
59
-
60
-
61
-
62
-
63
-
64
-
65
-
66
-
67
-
68
-
69
-
70
-
71
-
72
-
73
-
74
-
75
-
76
-
77
-
78
-
79
-
80
-
81
-
82
-
83
-
84
-
85
-
86
-
87
-
88
-
89
-
90
-
91
-
92
-
93
-
94
-
95
-
96
-
97
-
98
-
99
-
100
 |
 |

Management’s Discussion
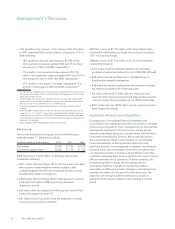
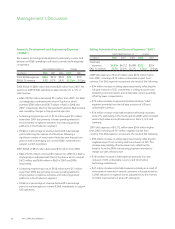
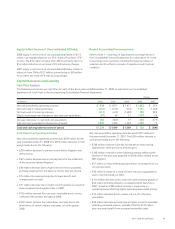
Research, Development and Engineering Expenses
(“R,D&E”)
We invest in technological development, particularly in color, and
believe our R,D&E spending is sufficient to remain technologically
competitive.
Year Ended December 31, Change
(in millions) 2008 2007 2006 2008 2007
Total R,D&E expenses $884 $912 $922 $28 $10
R,D&E % revenue 5.0% 5.3% 5.8% (0.3)pts (0.5)pts
2008 R,D&E of $884 million decreased $28 million from 2007. We
expect our 2009 R,D&E spending to approximate 4% to 5% of
total revenue.
• R&D of $750 million decreased $14 million from 2007. Our R&D
is strategically coordinated with that of Fuji Xerox, which
invested $788 million and $672 million in R&D in 2008 and
2007, respectively. Much of the reported Fuji Xerox R&D increase
was caused by changes in foreign exchange rates.
• Sustaining engineering costs of $134 million were $14 million
lower than 2007 due primarily to lower spending related to
environmental compliance activities and maturing product
platforms in the Production segment.
• R,D&E as a percentage of revenue declined 0.3-percentage
points reflecting the capture of efficiencies following a
significant number of new product launches over the past two
years as well as leveraging our current R,D&E investments to
support our GIS operations.
2007 R,D&E of $912 million decreased $10 million from 2006.
• R&D of $764 million increased $3 million from 2006. Our R&D is
strategically coordinated with that of Fuji Xerox, which invested
$672 million and $660 million in R&D in 2007 and 2006,
respectively.
• Sustaining engineering costs of $148 million were $13 million
lower than 2006 due primarily to lower spending related to
environmental compliance activities and maturing product
platforms in the Production segment.
• R,D&E as a percentage of revenue declined 0.5-percentage
points as we leveraged our current R,D&E investments to support
GIS operations.
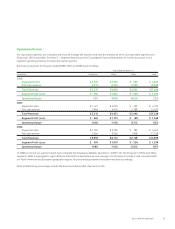
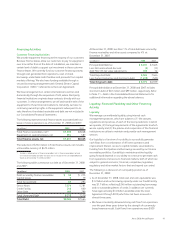
Selling, Administrative and General Expenses (“SAG”)
Year Ended December 31, Change
(in millions) 2008 2007 2006 2008 2007
Total SAG
expenses $4,534 $4,312 $4,008 $222 $304
SAG % revenue 25.7% 25.0% 25.2% 0.7pts (0.2)pts
2008 SAG expenses of $4,534 million were $222 million higher
than 2007, including a $12 million unfavorable impact from
currency. The SAG expense increase was the result of the following:
• $94 million increase in selling expenses primarily reflecting the
full year inclusion of GIS, investments in selling resources and
marketing communications and unfavorable currency partially
offset by lower compensation.
• $75 million increase in general and administrative (“G&A”)
expenses primarily from the full year inclusion of GIS and
unfavorable currency.
• $54 million increase in bad debt expense reflecting increased
write-offs, particularly in the fourth quarter 2008, which included
several high value account bankruptcies in the U.S., U.K. and
Germany.
2007 SAG expenses of $4,312 million were $304 million higher
than 2006, including a $141 million negative impact from
currency. The SAG expense increase was the result of the following:
• $93 million increase in selling expenses primarily reflecting the
negative impact from currency and the inclusion of GIS. This
increase was partially offset by lower costs reflecting the
benefits from the 2006 restructuring programs intended to
realign our sales infrastructure.
• $164 million increase in G&A expenses primarily from the
inclusion of GIS, unfavorable currency and information
technology investments.
• $47 million increase in bad debt expense primarily as a result of
an increase in reserves for several customers in Europe as well as
a 2006 reduction in expense due to adjustments to the reserves
to reflect improvement in write-offs and aging.
36 Xerox 2008 Annual Report