Xerox 2008 Annual Report Download - page 43
Download and view the complete annual report
Please find page 43 of the 2008 Xerox annual report below. You can navigate through the pages in the report by either clicking on the pages listed below, or by using the keyword search tool below to find specific information within the annual report.-
 1
1 -
2
-
3
-
4
-
5
-
6
-
7
-
8
-
9
-
10
-
11
-
12
-
13
-
14
-
15
-
16
-
17
-
18
-
19
-
20
-
21
-
22
-
23
-
24
-
25
-
26
-
27
-
28
-
29
-
30
-
31
-
32
-
 33
33 -
 34
34 -
 35
35 -
 36
36 -
 37
37 -
 38
38 -
 39
39 -
 40
40 -
 41
41 -
 42
42 -
 43
43 -
 44
44 -
 45
45 -
 46
46 -
 47
47 -
 48
48 -
 49
49 -
 50
50 -
 51
51 -
 52
52 -
 53
53 -
54
-
55
-
56
-
57
-
58
-
59
-
60
-
61
-
62
-
63
-
64
-
65
-
66
-
67
-
68
-
69
-
70
-
71
-
72
-
73
-
74
-
75
-
76
-
77
-
78
-
79
-
80
-
81
-
82
-
83
-
84
-
85
-
86
-
87
-
88
-
89
-
90
-
91
-
92
-
93
-
94
-
95
-
96
-
97
-
98
-
99
-
100
 |
 |

• $45 million decrease due to lower benefit accruals, partially
offset by higher accounts payable due to the timing of
payments to vendors and suppliers.
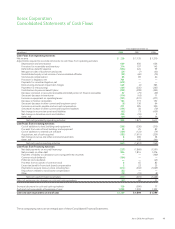
Net cash used in investing activities was $441 million for the year
ended December 31, 2008. The $1,171 million increase in cash was
primarily due to the following:
• $1,460 million increase due to less cash used for acquisitions.
2008 acquisitions included $138 million for Veenman B.V. and
Saxon Business Systems as compared to $1,568 million for GIS
and its additional acquisitions in the prior year.
• $192 million decrease due to lower funds from escrow and other
restricted investments in 2008. The prior year reflected funds
received from the run-off of our secured borrowing programs.
• $134 million decrease in other investing cash flows due to the
absence of proceeds from liquidations of short-term
investments.
Net cash used in investing activities was $1,612 million for the year
ended December 31, 2007. The $1,469 million decrease in cash
was primarily due to the following:
• $1,386 million decrease due to $1,615 million in 2007
acquisitions primarily comprised of $1,568 for GIS and its
additional acquisitions and $30 million for Advectis, Inc., as
compared to $229 million in acquisitions in 2006 comprised of
Amici, LLC and XMPie, Inc.
• $123 million decrease in other investing cash flows reflecting the
absence of the 2006 $122 million distribution related to the sale
of investments held by Ridge Re.
• $65 million decrease due to higher capital and internal use
software investments in 2007.
• $57 million decrease due to higher 2006 proceeds from sales of
land, buildings and equipment, which included the sale of our
corporate headquarters and a parcel of vacant land.
• $162 million increase due to a reduction in escrow and other
restricted investments in 2007, as we continue to run-off our
secured borrowing programs.
Net cash used in financing activities was $311 million for the year
ended December 31, 2008. The $308 million increase in cash was
primarily due to the following:
• $1,642 million increase from lower net repayments on secured
debt. 2007 reflects termination of our secured financing
programs with GE in the United Kingdom and Canada of $634
million and Merrill Lynch in France for $469 million as well as the
repayment of secured borrowings to DLL of $153 million. The
remainder reflects lower payments associated with our GE U.S.
secured borrowings.
• $888 million decrease from lower net cash proceeds from
unsecured debt. 2008 reflects the issuance of $1.4 billion in
Senior Notes, $250 million from a private placement borrowing
and net payments of $354 million on the Credit Facility and
$370 million on other debt. 2007 reflects the issuance of $1.1
billion Senior Notes, $400 million from private placement
borrowings and net proceeds of $600 million on the Credit
Facility, offset by net payments of $286 million on other debt.
• $180 million decrease due to additional purchases under our
share repurchase program.
• $154 million decrease due to common stock dividend payments.
• $79 million decrease due to lower proceeds from the issuance of
common stock, reflecting a decrease in stock option exercises as
well as lower related tax benefits.
• $33 million decrease due to share repurchases related to
employee withholding taxes on stock-based compensation
vesting.
Net cash used in financing activities was $619 million in year
ended December 31, 2007. The $809 million increase in cash was
primarily due to the following:
• $538 million increase due to higher net cash proceeds from
unsecured debt. This reflects the May 2007 issuance of the $1.1
billion Senior Notes, the issuances of two zero coupon bonds in
2007 resulting in net proceeds of approximately $400 million,
and the net drawdown of $600 million under the 2007 Credit
Facility. These higher net proceeds were partially offset by the
March 2006 issuance of the $700 million Senior Notes and the
August 2006 issuance of an additional $650 million of Senior
Notes, as well as, higher repayments on other unsecured debt in
2007 as compared to 2006.
• $437 million increase due to lower purchases under our share
repurchase program as cash was invested in acquisitions.
• $100 million increase relating to the 2006 payment of our
liability to Xerox Capital LLC in connection with their redemption
of Canadian deferred preferred shares.
• $278 million decrease due to higher net repayments of secured
financing. Refer to Note 4-Receivables, net in the consolidated
financial statements for further information.
40 Xerox 2008 Annual Report
Financing Activities
Customer Financing Activities
We provide equipment financing to the majority of our customers.
Because finance leases allow our customers to pay for equipment
over time rather than at the date of installation, we maintain a
certain level of debt to support our investment in these customer
finance leases. We currently fund our customer financing activity
through cash generated from operations, cash on hand,
borrowings under bank credit facilities and proceeds from capital
markets offerings. We also have funding available through a
secured borrowing arrangement with General Electric Capital
Corporation (“GECC”) referred to as the Loan Agreement.
We have arrangements in certain international countries and
domestically through the acquisition of GIS, where third party
financial institutions originate lease contracts directly with our
customers. In these arrangements, we sell and transfer title of the
equipment to these financial institutions. Generally, we have no
continuing ownership rights in the equipment subsequent to its
sale; therefore, the related receivable and debt are not included in
our Consolidated Financial Statements.
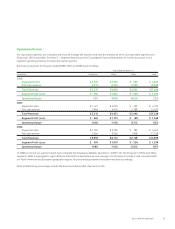
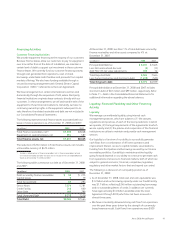
The following represents total finance assets associated with our
lease or finance operations as of December 31, 2008 and 2007:
(in millions) 2008 2007
Total Finance receivables, net(1) $7,278 $8,048
Equipment on operating leases, net 594 587
Total finance assets, net $7,872 $8,635
The reduction of $763 million in Total finance assets, net includes
unfavorable currency of $473 million.
(1) Includes (i) billed portion of finance receivables, net, (ii) finance receivables, net and
(iii) finance receivables due after one year, net as included in the Consolidated Balance
Sheets as of December 31, 2008 and 2007.
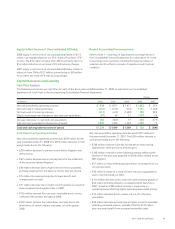
The following tables summarize our debt as of December 31, 2008
and 2007:
(in millions) 2008 2007
Debt secured by finance receivables $ 56 $ 275
Capital leases 919
Total Secured Debt 65 294
Senior Notes 7,574 5,781
Credit Facility 246 600
Other Debt 499 789
Total Unsecured Debt 8,319 7,170
Total Debt $8,384 $7,464
At December 31, 2008, less than 1% of total debt was secured by
finance receivables and other assets compared to 4% at
December 31, 2007.
(in millions) 2008 2007
Principal Debt Balance $ 8,201 $7,465
Less: Net unamortized discount (6) (13)
Add: FAS 133 fair value adjustments 189 12
Total Reported Debt 8,384 7,464
Less: Current maturities and short-term debt (1,610) (525)
Total long-term debt $ 6,774 $6,939
Principal debt balance at December 31, 2008 and 2007 includes
short-term debt of $61 million and $99 million, respectively. Refer
to Note 11 – Debt in the Consolidated Financial Statements for
additional information regarding the above balances.
Liquidity, Financial Flexibility and Other Financing
Activity
Liquidity
We manage our worldwide liquidity using internal cash
management practices, which are subject to (1) the statutes,
regulations and practices of each of the local jurisdictions in which
we operate, (2) the legal requirements of the agreements to which
we are a party and (3) the policies and cooperation of the financial
institutions we utilize to maintain and provide cash management
services.
Our liquidity is a function of our ability to successfully generate
cash flows from a combination of efficient operations and
improvement therein, access to capital markets, securitizations,
funding from third parties and borrowings secured by our finance
receivables portfolios. Our ability to maintain positive liquidity
going forward depends on our ability to continue to generate cash
from operations and access to financial markets, both of which are
subject to general economic, financial, competitive, legislative,
regulatory and other market factors that are beyond our control.
The following is a discussion of our liquidity position as of
December 31, 2008:
• As of December 31, 2008, total cash and cash equivalents was
$1.2 billion and our borrowing capacity under our Credit Facility
was $1.7 billion, reflecting $246 million outstanding borrowings
and no outstanding letters of credit. In addition we currently
have approximately $1.0 billion available under the Loan
Agreement through 2010, which has not been accessed in
almost three years.
• We have consistently delivered strong cash flow from operations
over the past three years driven by the strength of our annuity
based revenue model. Cash flows from operations were $939
Xerox 2008 Annual Report 41