Xerox 2008 Annual Report Download - page 31
Download and view the complete annual report
Please find page 31 of the 2008 Xerox annual report below. You can navigate through the pages in the report by either clicking on the pages listed below, or by using the keyword search tool below to find specific information within the annual report.-
 1
1 -
2
-
3
-
4
-
5
-
6
-
7
-
8
-
9
-
10
-
11
-
12
-
13
-
14
-
15
-
16
-
17
-
18
-
19
-
20
-
 21
21 -
 22
22 -
 23
23 -
 24
24 -
 25
25 -
 26
26 -
 27
27 -
 28
28 -
 29
29 -
 30
30 -
 31
31 -
 32
32 -
 33
33 -
 34
34 -
 35
35 -
 36
36 -
 37
37 -
 38
38 -
 39
39 -
 40
40 -
 41
41 -
42
-
43
-
44
-
45
-
46
-
47
-
48
-
49
-
50
-
51
-
52
-
53
-
54
-
55
-
56
-
57
-
58
-
59
-
60
-
61
-
62
-
63
-
64
-
65
-
66
-
67
-
68
-
69
-
70
-
71
-
72
-
73
-
74
-
75
-
76
-
77
-
78
-
79
-
80
-
81
-
82
-
83
-
84
-
85
-
86
-
87
-
88
-
89
-
90
-
91
-
92
-
93
-
94
-
95
-
96
-
97
-
98
-
99
-
100
 |
 |

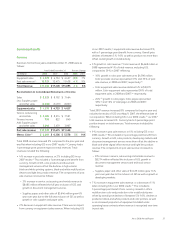
• 14% growth in color revenue. Color revenue of $6,356 million
in 2007 comprised 39% of total revenue, compared to 35% in
2006 reflecting:
– 18% growth in color post sale revenue to $4,180 million.
Color post sale revenue represented 35% and 31% of post
sale revenue, in 2007 and 2006, respectively.(4)
– 7% growth in color equipment sales revenue to $2,176
million. Color equipment sales represented 49% and 45% of
total equipment sales, in 2007 and 2006, respectively.(4)
– 31% growth in color pages. Color pages represented 12%
and 9% of total pages in 2007 and 2006, respectively.(4)
(1) Post sale revenue is largely a function of the equipment placed at customer locations, the
volume of prints and copies that our customers make on that equipment, the mix of color
pages and associated services.
The percentage point impacts from GIS reflect the revenue growth year-over-year after
including GIS’s results for 2007 and 2006 on a proforma basis. See “Non-GAAP Financial
Measures” section for an explanation of this non-GAAP measure.
Color revenues represent a subset of total revenues and excludes the impact of GIS’s
revenues.
(4) As of December 31, 2008, total color, color post sale and color equipment sales revenues
comprised 41%, 37% and 50%, respectively, if calculated on total, total post sale, and
total equipment sales revenues, including GIS. GIS is excluded from the color information
presented, because the breakout of the information required to make this computation for
all periods is not available.
(5) Pages include estimates for developing markets, GIS and printers.
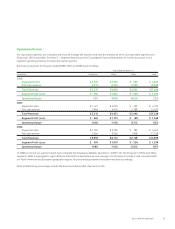
Net income and diluted earnings per share for the three years
ended December 31, 2008 were as follows:
(in millions, except per share amounts) 2007 2006
Net income $1,135 $1,210
Diluted earnings per share $ 1.19 $ 1.22
2008 Net income of $230 million, or $0.26 per diluted share,
included the following:
• $491 million after-tax charges ($774 million pre-tax) associated
with securities-related litigation matters as well as other
probable litigation-related losses including $36 million for the
Brazilian labor-related contingencies.
• $292 million after-tax charge ($426 million pre-tax) for second,
third and fourth quarter 2008 restructuring and asset
impairment actions.
• $24 million after-tax charge ($39 million pre-tax) for an Office
product line equipment write-off.
• $41 million income tax benefit from the settlement of certain
previously unrecognized tax benefits.
2007 Net income of $1,135 million, or $1.19 per diluted share,
included $30 million after-tax charge for our share of Fuji Xerox
(“FX”) restructuring charges.
2006 Net income of $1,210 million, or $1.22 per diluted share,
included the following:
• $472 million income tax benefit related to the favorable
resolution of certain tax matters from the 1999-2003 IRS audit.
• $68 million (pre-tax and after-tax) for probable losses on
Brazilian labor-related contingencies.
• $46 million tax benefit resulting from the resolution of certain
tax matters associated with foreign tax audits.
• $9 million after-tax ($13 million pre-tax) charge from the
write-off of the remaining unamortized deferred debt issuance
costs as a result of the termination of our 2003 Credit Facility.
• $257 million after-tax ($385 million pre-tax) restructuring and
asset impairment charges.
In preparing our Consolidated Financial Statements and
accounting for the underlying transactions and balances, we apply
various accounting policies. Senior management has discussed the
development and selection of the critical accounting policies,
estimates and related disclosures, included herein, with the Audit
Committee of the Board of Directors. We consider the policies
discussed below as critical to understanding our Consolidated
Financial Statements, as their application places the most
significant demands on management’s judgment, since financial
reporting results rely on estimates of the effects of matters that
are inherently uncertain. In instances where different estimates
could have reasonably been used, we disclosed the impact of these
different estimates on our operations. In certain instances, like
revenue recognition for leases, the accounting rules are
prescriptive; therefore, it would not have been possible to
reasonably use different estimates. Changes in assumptions and
estimates are reflected in the period in which they occur. The
impact of such changes could be material to our results of
operations and financial condition in any quarterly or annual
period.
28 Xerox 2008 Annual Report
Specific risks associated with these critical accounting policies are
discussed throughout the MD&A, where such policies affect our
reported and expected financial results. For a detailed discussion of
the application of these and other accounting policies, refer to
Note 1 – Summary of Significant Accounting Policies, in the
Consolidated Financial Statements.
Revenue Recognition for Leases
Our accounting for leases involves specific determinations under
applicable lease accounting standards, which often involve
complex and prescriptive provisions. These provisions affect the
timing of revenue recognition for our equipment. If a lease
qualifies as a sales-type capital lease, equipment revenue is
recognized upon delivery or installation of the equipment as sale
revenue as opposed to ratably over the lease term. The critical
elements that we consider with respect to our lease accounting are
the determination of the economic life and the fair value of
equipment, including the residual value. For purposes of
determining the economic life, we consider the most objective
measure to be the original contract term, since most equipment is
returned by lessees at or near the end of the contracted term. The
economic life of most of our products is five years since this
represents the most frequent contractual lease term for our
principal products and only a small percentage of our leases are for
original terms longer than five years. There is no significant after-
market for our used equipment. We believe five years is
representative of the period during which the equipment is
expected to be economically usable, with normal service, for the
purpose for which it is intended.
Revenue Recognition Under Bundled Arrangements
We sell the majority of our products and services under bundled
lease arrangements, which typically include equipment, service,
supplies and financing components for which the customer pays a
single negotiated monthly fixed price for all elements over the
contractual lease term. Typically these arrangements include an
incremental, variable component for page volumes in excess of
contractual page volume minimums, which are often expressed in
terms of price per page. Revenues under these arrangements are
allocated, considering the relative fair values of the lease and
non-lease deliverables included in the bundled arrangement, based
upon the estimated relative fair values of each element. Lease
deliverables include maintenance and executory costs, equipment
and financing, while non-lease deliverables generally consist of
supplies and non-maintenance services. Our revenue allocation for
lease deliverables begins by allocating revenues to the
maintenance and executory costs plus profit thereon. The
remaining amounts are allocated to the equipment and financing
elements. We perform extensive analyses of available verifiable
objective evidence of equipment fair value based on cash selling
prices during the applicable period. The cash selling prices are
compared to the range of values included in our lease accounting
systems. The range of cash selling prices must be reasonably
consistent with the lease selling prices, taking into account residual
values, in order for us to determine that such lease prices are
indicative of fair value.
Our pricing interest rates, which are used in determining customer
payments, are developed based upon a variety of factors including
local prevailing rates in the marketplace and the customer’s credit
history, industry and credit class. We reassess our pricing interest
rates quarterly based on changes in the local prevailing rates in the
marketplace. These interest rates have been historically adjusted if
the rates vary by twenty-five basis points or more, cumulatively,
from the last rate in effect. The pricing interest rates generally
equal the implicit rates within the leases, as corroborated by our
comparisons of cash to lease selling prices. In light of worldwide
economic conditions prevailing at the end of 2008, we expect to
continually review this methodology in 2009 to ensure that our
pricing interest rates are reflective of changes in the local
prevailing rates in the marketplace.
Allowance for Doubtful Accounts and Credit Losses
We perform ongoing credit evaluations of our customers and
adjust credit limits based upon customer payment history and
current creditworthiness. We continuously monitor collections and
payments from our customers and maintain a provision for
estimated credit losses based upon our historical experience and
any specific customer collection issues that have been identified.
While such credit losses have historically been within our
expectations and the provisions established, we cannot guarantee
that we will continue to experience credit loss rates similar to those
we have experienced in the past. Measurement of such losses
requires consideration of historical loss experience, including the
need to adjust for current conditions, and judgments about the
probable effects of relevant observable data, including present
economic conditions such as delinquency rates and financial
health of specific customers. We recorded bad debt provisions of
$188 million, $134 million and $87 million in SAG expenses in our
Consolidated Statements of Income for the years ended
December 31, 2008, 2007 and 2006, respectively.
Historically, the majority of the bad debt provision relates to our
finance receivables portfolio. This provision is inherently more
difficult to estimate than the provision for trade accounts
receivable because the underlying lease portfolio has an average
maturity, at any time, of approximately two to three years and
contains past due billed amounts, as well as unbilled amounts. The
estimated credit quality of any given customer and class of
customer or geographic location can significantly change during
Xerox 2008 Annual Report 29