Xerox 2008 Annual Report Download - page 41
Download and view the complete annual report
Please find page 41 of the 2008 Xerox annual report below. You can navigate through the pages in the report by either clicking on the pages listed below, or by using the keyword search tool below to find specific information within the annual report.-
 1
1 -
2
-
3
-
4
-
5
-
6
-
7
-
8
-
9
-
10
-
11
-
12
-
13
-
14
-
15
-
16
-
17
-
18
-
19
-
20
-
21
-
22
-
23
-
24
-
25
-
26
-
27
-
28
-
29
-
30
-
 31
31 -
 32
32 -
 33
33 -
 34
34 -
 35
35 -
 36
36 -
 37
37 -
 38
38 -
 39
39 -
 40
40 -
 41
41 -
 42
42 -
 43
43 -
 44
44 -
 45
45 -
 46
46 -
 47
47 -
 48
48 -
 49
49 -
 50
50 -
 51
51 -
52
-
53
-
54
-
55
-
56
-
57
-
58
-
59
-
60
-
61
-
62
-
63
-
64
-
65
-
66
-
67
-
68
-
69
-
70
-
71
-
72
-
73
-
74
-
75
-
76
-
77
-
78
-
79
-
80
-
81
-
82
-
83
-
84
-
85
-
86
-
87
-
88
-
89
-
90
-
91
-
92
-
93
-
94
-
95
-
96
-
97
-
98
-
99
-
100
 |
 |

• $721 million reflecting provisions for the $670 million court
• $36 million for probable losses on Brazilian labor-related
• $24 million associated with probable losses from various other
• $68 million for probable losses on Brazilian labor-related
• $33 million associated with probable losses from various legal
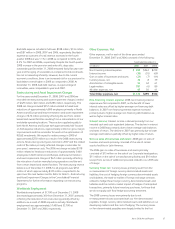
Equity in Net Income of Unconsolidated Affiliates
2008 equity in net income of unconsolidated affiliates of $113
million is principally related to our 25% share of Fuji Xerox (“FX”)
income. The $16 million increase from 2007 is primarily due to a
$14 million reduction in our share of FX restructuring charges.
2007 equity in net income of unconsolidated affiliates reflects a
reduction from 2006 of $17 million, primarily due to $30 million
for our after-tax share of FX restructuring charges.
Recent Accounting Pronouncements
Refer to Note 1 – Summary of Significant Accounting Policies in
the Consolidated Financial Statements for a description of recent
accounting pronouncements including the respective dates of
adoption and the effects on results of operations and financial
condition.
Capital Resources and Liquidity
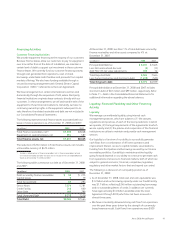
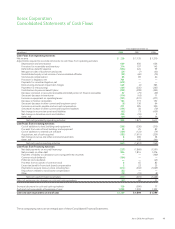
Cash Flow Analysis
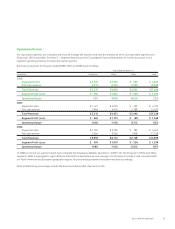
The following summarizes our cash flows for each of the three years ended December 31, 2008, as reported in our Consolidated
Statements of Cash Flows in the accompanying Consolidated Financial Statements:
Change
(in millions) 2008 2007 2006 2008 2007
Net cash provided by operating activities $ 939 $ 1,871 $ 1,617 $ (932) $ 254
Net cash used in investing activities (441) (1,612) (143) 1,171 (1,469)
Net cash used in financing activities (311) (619) (1,428) 308 809
Effect of exchange rate changes on cash and cash equivalents (57) 60 31 (117) 29
Increase (decrease) in cash and cash equivalents 130 (300) 77 430 (377)
Cash and cash equivalents at beginning of period 1,099 1,399 1,322 (300) 77
Cash and cash equivalents at end of period $1,229 $ 1,099 $ 1,399 $ 130 $ (300)
Cash Flows from Operating Activities
Net cash provided by operating activities was $939 million for the
year ended December 31, 2008. The $932 million decrease in cash
was primarily due to the following:
• $330 million decrease in pre-tax income before litigation and
restructuring.
• $615 million decrease due to net payments for the settlement
of the securities-related litigation.
• $90 million decrease due to higher net income tax payments,
primarily resulting from the absence of prior year tax refunds.
• $74 million decrease primarily due to lower benefit and
compensation accruals.
• $71 million decrease due to higher inventory levels as a result of
lower equipment and supplies sales in 2008.
• $136 million increase from accounts receivable due to strong
collection effectiveness throughout 2008.
• $107 million increase from derivatives, primarily due to the
termination of certain interest rate swaps in fourth quarter
2008.
Net cash provided by operating activities was $1,871 million for
the year ended December 31, 2007. The $254 million increase in
cash was primarily due to the following:
• $348 million increase in pre-tax income before restructuring,
depreciation, other provisions and net gains.
• $108 million increase in other liabilities primarily reflecting the
absence of the prior year payment of $106 million related to the
MPI litigation.
• $57 million increase reflecting lower pension contributions to our
U.S. pension plans.
• $30 million increase as a result of lower restructuring payments
due to minimal activity in 2007.
• $114 million decrease due to year-over-year inventory growth of
$54 million primarily related to increased product launches in
2007, as well as a $60 million increase in equipment on
operating leases reflecting higher operating lease install activity.
• $73 million decrease due to a lower net run-off of finance
receivables.
• $49 million decrease primarily due to higher accounts receivable
reflecting increased revenue, partially offset by $110 million
year-over-year benefit from increased receivables sales.
Xerox 2008 Annual Report 39