Xerox 2008 Annual Report Download - page 30
Download and view the complete annual report
Please find page 30 of the 2008 Xerox annual report below. You can navigate through the pages in the report by either clicking on the pages listed below, or by using the keyword search tool below to find specific information within the annual report.-
 1
1 -
2
-
3
-
4
-
5
-
6
-
7
-
8
-
9
-
10
-
11
-
12
-
13
-
14
-
15
-
16
-
17
-
18
-
19
-
 20
20 -
 21
21 -
 22
22 -
 23
23 -
 24
24 -
 25
25 -
 26
26 -
 27
27 -
 28
28 -
 29
29 -
 30
30 -
 31
31 -
 32
32 -
 33
33 -
 34
34 -
 35
35 -
 36
36 -
 37
37 -
 38
38 -
 39
39 -
 40
40 -
41
-
42
-
43
-
44
-
45
-
46
-
47
-
48
-
49
-
50
-
51
-
52
-
53
-
54
-
55
-
56
-
57
-
58
-
59
-
60
-
61
-
62
-
63
-
64
-
65
-
66
-
67
-
68
-
69
-
70
-
71
-
72
-
73
-
74
-
75
-
76
-
77
-
78
-
79
-
80
-
81
-
82
-
83
-
84
-
85
-
86
-
87
-
88
-
89
-
90
-
91
-
92
-
93
-
94
-
95
-
96
-
97
-
98
-
99
-
100
 |
 |

Management’s Discussion
• 14% growth in color revenue.(3) Color revenue of $6,356 million
in 2007 comprised 39% of total revenue, compared to 35% in
2006 reflecting:
– 18% growth in color post sale revenue to $4,180 million.
Color post sale revenue represented 35% and 31% of post
sale revenue, in 2007 and 2006, respectively.(4)
– 7% growth in color equipment sales revenue to $2,176
million. Color equipment sales represented 49% and 45% of
total equipment sales, in 2007 and 2006, respectively.(4)
– 31% growth in color pages. Color pages represented 12%
and 9% of total pages in 2007 and 2006, respectively.(4)
(1) Post sale revenue is largely a function of the equipment placed at customer locations, the
volume of prints and copies that our customers make on that equipment, the mix of color
pages and associated services.
(2) The percentage point impacts from GIS reflect the revenue growth year-over-year after
including GIS’s results for 2007 and 2006 on a proforma basis. See “Non-GAAP Financial
Measures” section for an explanation of this non-GAAP measure.
(3) Color revenues represent a subset of total revenues and excludes the impact of GIS’s
revenues.
(4) As of December 31, 2008, total color, color post sale and color equipment sales revenues
comprised 41%, 37% and 50%, respectively, if calculated on total, total post sale, and
total equipment sales revenues, including GIS. GIS is excluded from the color information
presented, because the breakout of the information required to make this computation for
all periods is not available.
(5) Pages include estimates for developing markets, GIS and printers.
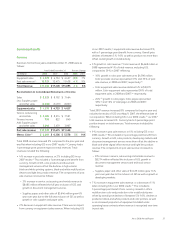
Net Income
Net income and diluted earnings per share for the three years
ended December 31, 2008 were as follows:
(in millions, except per share amounts) 2008 2007 2006
Net income $ 230 $1,135 $1,210
Diluted earnings per share $0.26 $ 1.19 $ 1.22
2008 Net income of $230 million, or $0.26 per diluted share,
included the following:
• $491 million after-tax charges ($774 million pre-tax) associated
with securities-related litigation matters as well as other
probable litigation-related losses including $36 million for the
Brazilian labor-related contingencies.
• $292 million after-tax charge ($426 million pre-tax) for second,
third and fourth quarter 2008 restructuring and asset
impairment actions.
• $24 million after-tax charge ($39 million pre-tax) for an Office
product line equipment write-off.
• $41 million income tax benefit from the settlement of certain
previously unrecognized tax benefits.
2007 Net income of $1,135 million, or $1.19 per diluted share,
included $30 million after-tax charge for our share of Fuji Xerox
(“FX”) restructuring charges.
2006 Net income of $1,210 million, or $1.22 per diluted share,
included the following:
• $472 million income tax benefit related to the favorable
resolution of certain tax matters from the 1999-2003 IRS audit.
• $68 million (pre-tax and after-tax) for probable losses on
Brazilian labor-related contingencies.
• $46 million tax benefit resulting from the resolution of certain
tax matters associated with foreign tax audits.
• $9 million after-tax ($13 million pre-tax) charge from the
write-off of the remaining unamortized deferred debt issuance
costs as a result of the termination of our 2003 Credit Facility.
• $257 million after-tax ($385 million pre-tax) restructuring and
asset impairment charges.
Application of Critical Accounting Policies
In preparing our Consolidated Financial Statements and
accounting for the underlying transactions and balances, we apply
various accounting policies. Senior management has discussed the
development and selection of the critical accounting policies,
estimates and related disclosures, included herein, with the Audit
Committee of the Board of Directors. We consider the policies
discussed below as critical to understanding our Consolidated
Financial Statements, as their application places the most
significant demands on management’s judgment, since financial
reporting results rely on estimates of the effects of matters that
are inherently uncertain. In instances where different estimates
could have reasonably been used, we disclosed the impact of these
different estimates on our operations. In certain instances, like
revenue recognition for leases, the accounting rules are
prescriptive; therefore, it would not have been possible to
reasonably use different estimates. Changes in assumptions and
estimates are reflected in the period in which they occur. The
impact of such changes could be material to our results of
operations and financial condition in any quarterly or annual
period.
28 Xerox 2008 Annual Report