Xerox 2008 Annual Report Download - page 90
Download and view the complete annual report
Please find page 90 of the 2008 Xerox annual report below. You can navigate through the pages in the report by either clicking on the pages listed below, or by using the keyword search tool below to find specific information within the annual report.-
 1
1 -
2
-
3
-
4
-
5
-
6
-
7
-
8
-
9
-
10
-
11
-
12
-
13
-
14
-
15
-
16
-
17
-
18
-
19
-
20
-
21
-
22
-
23
-
24
-
25
-
26
-
27
-
28
-
29
-
30
-
31
-
32
-
33
-
34
-
35
-
36
-
37
-
38
-
39
-
40
-
41
-
42
-
43
-
44
-
45
-
46
-
47
-
48
-
49
-
50
-
51
-
52
-
53
-
54
-
55
-
56
-
57
-
58
-
59
-
60
-
61
-
62
-
63
-
64
-
65
-
66
-
67
-
68
-
69
-
70
-
71
-
72
-
73
-
74
-
75
-
76
-
77
-
78
-
79
-
 80
80 -
 81
81 -
 82
82 -
 83
83 -
 84
84 -
 85
85 -
 86
86 -
 87
87 -
 88
88 -
 89
89 -
 90
90 -
 91
91 -
 92
92 -
 93
93 -
 94
94 -
 95
95 -
 96
96 -
 97
97 -
 98
98 -
 99
99 -
 100
100
 |
 |

Notes to the Consolidated
Financial Statements
(in millions, except per share data and
unless otherwise indicated)
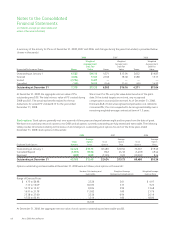
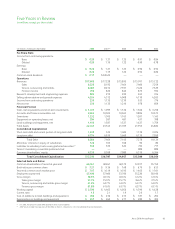
A summary of the activity for PSs as of December 31, 2008, 2007 and 2006, and changes during the years then ended, is presented below
(shares in thousands):
2008 2007 2006
Nonvested Performance Shares Shares
Weighted
Average Grant
Date Fair
Value Shares
Weighted
Average Grant
Date Fair
Value Shares
Weighted
Average Grant
Date Fair
Value
Outstanding at January 1 6,585 $16.16 4,571 $15.04 2,052 $14.87
Granted 3,696 13.67 2,160 18.48 2,588 15.17
Vested (2,734) 14.87 ————
Cancelled (169) 16.05 (146) 15.41 (69) 14.95
Outstanding at December 31 7,378 $15.39 6,585 $16.16 4,571 $15.04
At December 31, 2008, the aggregate intrinsic value of PSs
outstanding was $59. The total intrinsic value of PS’s vested during
2008 was $41. The actual tax benefit realized for the tax
deductions for vested PS’s totaled $13 for the year ended
December 31, 2008.
We account for PSs using fair value determined as of the grant
date. If the stated targets are not met, any recognized
compensation cost would be reversed. As of December 31, 2008,
there was $48 of total unrecognized compensation cost related to
nonvested PSs; this cost is expected to be recognized ratably over a
remaining weighted-average contractual term of 1.5 years.
Stock options: Stock options generally vest over a period of three years and expire between eight and ten years from the date of grant.
We have not issued any new stock options since 2004 and all options currently outstanding are fully vested and exercisable. The following
table provides information relating to the status of, and changes in, outstanding stock options for each of the three years ended
December 31, 2008 (stock options in thousands):
2008 2007 2006
Employee Stock Options
Stock
Options
Average
Option
Price
Stock
Options
Average
Option
Price
Stock
Options
Average
Option
Price
Outstanding at January 1 52,424 $19.73 60,480 $18.56 76,307 $ 19.40
Cancelled/Expired (6,559) 50.08 (922) 24.18 (5,478) 49.44
Exercised (680) 8.89 (7,134) 9.22 (10,349) 8.46
Outstanding at December 31 45,185 $15.49 52,424 $19.73 60,480 $18.56
Options outstanding and exercisable at December 31, 2008 were as follows (stock options in thousands):
Number Outstanding and
Exercisable
Weighted Average
Remaining Contractual Life
Weighted Average
Exercise Price
Range of Exercise Prices
$ 4.75 to $6.98 2,526 2.01 $ 4.97
7.13 to 10.69 18,493 3.37 9.23
10.72 to 15.27 8,024 2.99 13.68
16.91 to 21.78 11,092 1.00 21.76
25.38 to 27.00 3,536 0.94 26.19
47.50 to 60.44 1,514 1.00 48.00
45,185
At December 31, 2008, the aggregate intrinsic value of stock options outstanding and exercisable was $8.
88 Xerox 2008 Annual Report