Xerox 2008 Annual Report Download - page 61
Download and view the complete annual report
Please find page 61 of the 2008 Xerox annual report below. You can navigate through the pages in the report by either clicking on the pages listed below, or by using the keyword search tool below to find specific information within the annual report.-
 1
1 -
2
-
3
-
4
-
5
-
6
-
7
-
8
-
9
-
10
-
11
-
12
-
13
-
14
-
15
-
16
-
17
-
18
-
19
-
20
-
21
-
22
-
23
-
24
-
25
-
26
-
27
-
28
-
29
-
30
-
31
-
32
-
33
-
34
-
35
-
36
-
37
-
38
-
39
-
40
-
41
-
42
-
43
-
44
-
45
-
46
-
47
-
48
-
49
-
50
-
 51
51 -
 52
52 -
 53
53 -
 54
54 -
 55
55 -
 56
56 -
 57
57 -
 58
58 -
 59
59 -
 60
60 -
 61
61 -
 62
62 -
 63
63 -
 64
64 -
 65
65 -
 66
66 -
 67
67 -
 68
68 -
 69
69 -
 70
70 -
 71
71 -
72
-
73
-
74
-
75
-
76
-
77
-
78
-
79
-
80
-
81
-
82
-
83
-
84
-
85
-
86
-
87
-
88
-
89
-
90
-
91
-
92
-
93
-
94
-
95
-
96
-
97
-
98
-
99
-
100
 |
 |

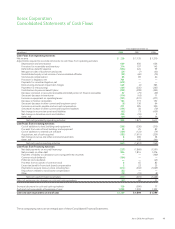
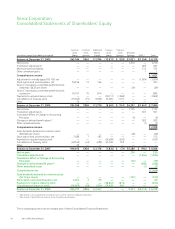
Notes to the Consolidated
Financial Statements
(in millions, except per share data and
unless otherwise indicated)
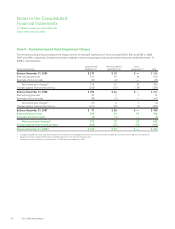
Selected financial information for our Operating segments for each of the years ended December 31, 2008, 2007 and 2006, respectively,
was as follows:
Production Office Other Total
2008(1)
Revenues $4,937 $9,347 $2,526 $16,810
Finance income 300 481 17 798
Total Segment Revenues $5,237 $9,828 $2,543 $17,608
Interest expense $ 117 $ 181 $ 269 $ 567
Segment profit (loss)(2) 394 1,062 (165) 1,291
Equity in net income of unconsolidated affiliates $ — $ — $ 113 $ 113
2007(1)
Revenues $5,001 $ 8,980 $ 2,425 $ 16,406
Finance income 314 493 15 822
Total Segment Revenues $5,315 $9,473 $2,440 $17,228
Interest expense $ 123 $ 186 $ 270 $ 579
Segment profit (loss)(2) 562 1,115 (89) 1,588
Equity in net income of unconsolidated affiliates $ — $ — $ 97 $ 97
2006(1)
Revenues $4,735 $ 8,207 $ 2,113 $ 15,055
Finance income 320 505 15 840
Total Segment Revenues $5,055 $8,712 $2,128 $15,895
Interest expense $ 119 $ 181 $ 244 $ 544
Segment profit (loss)(2) 504 1,010 (124) 1,390
Equity in net income of unconsolidated affiliates $ — $ — $ 114 $ 114
(1) Asset information on a segment basis is not disclosed as this information is not separately identified and internally reported to our chief executive officer.
(2) Depreciation and amortization expense is recorded in cost of sales, research, development and engineering expenses and selling, administrative and general expenses and is included in the
segment profit above. This information is neither identified nor internally reported to our chief executive officer. The separate identification of this information for purposes of segment
disclosure is impracticable, as it is not readily available and the cost to develop it would be excessive.
Xerox 2008 Annual Report 59