Xerox 2008 Annual Report Download - page 89
Download and view the complete annual report
Please find page 89 of the 2008 Xerox annual report below. You can navigate through the pages in the report by either clicking on the pages listed below, or by using the keyword search tool below to find specific information within the annual report.-
 1
1 -
2
-
3
-
4
-
5
-
6
-
7
-
8
-
9
-
10
-
11
-
12
-
13
-
14
-
15
-
16
-
17
-
18
-
19
-
20
-
21
-
22
-
23
-
24
-
25
-
26
-
27
-
28
-
29
-
30
-
31
-
32
-
33
-
34
-
35
-
36
-
37
-
38
-
39
-
40
-
41
-
42
-
43
-
44
-
45
-
46
-
47
-
48
-
49
-
50
-
51
-
52
-
53
-
54
-
55
-
56
-
57
-
58
-
59
-
60
-
61
-
62
-
63
-
64
-
65
-
66
-
67
-
68
-
69
-
70
-
71
-
72
-
73
-
74
-
75
-
76
-
77
-
78
-
 79
79 -
 80
80 -
 81
81 -
 82
82 -
 83
83 -
 84
84 -
 85
85 -
 86
86 -
 87
87 -
 88
88 -
 89
89 -
 90
90 -
 91
91 -
 92
92 -
 93
93 -
 94
94 -
 95
95 -
 96
96 -
 97
97 -
 98
98 -
 99
99 -
100
 |
 |

• Contracts that we entered into for the sale or purchase of
• Guarantees on behalf of our subsidiaries with respect to real
• Agreements to indemnify various service providers, trustees and
• Guarantees of our performance in certain sales and services
Notes to the Consolidated
Financial Statements
(in millions, except per share data and
unless otherwise indicated)
circumstances, particularly in certain cash sales, we may issue a
limited product warranty if negotiated by the customer. We also
issue warranties for certain of our lower-end products in the Office
segment, where full service maintenance agreements are not
available. In these instances, we record warranty obligations at the
time of the sale. Aggregate product warranty liability expenses for
the three years ended December 31, 2008 were $39, $40 and $43,
respectively. Total product warranty liabilities as of December 31,
2008 and 2007 were $27 and $26, respectively.
Note 17 – Shareholders’ Equity
Preferred Stock
As of December 31, 2008, we had no preferred stock shares or
preferred stock purchase rights outstanding. We are authorized to
issue approximately 22 million shares of cumulative preferred
stock, $1.00 par value.
Common Stock
We have 1.75 billion authorized shares of common stock, $1 par
value. At December 31, 2008, 90 million shares were reserved for
issuance under our incentive compensation plans, 48 million shares
were reserved for debt to equity exchanges and 2 million shares
were reserved for the conversion of convertible debt.
Stock-Based Compensation
We have a long-term incentive plan whereby eligible employees
may be granted restricted stock units (“RSUs”), performance shares
(“PSs”) and non-qualified stock options.
We grant PSs and RSUs in order to continue to attract and retain
employees and to better align employee interest with those of our
shareholders. Each of these awards is subject to settlement with
newly issued shares of our common stock. At December 31, 2008
and 2007, 15 million and 19 million shares, respectively, were
available for grant of awards.
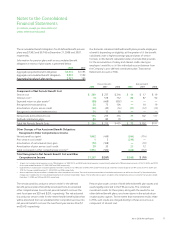
Stock-based compensation expense for the three years ended
December 31, 2008 was as follows:
2008 2007 2006
Stock-based compensation expense, pre-tax $85 $89 $64
Stock-based compensation expense, net of tax 52 55 39
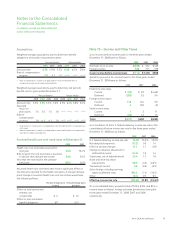
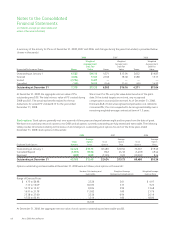
Restricted stock units: Compensation expense is based upon the grant date market price and is recorded over the vesting period. RSU
awards vest three years from the date of the grant. A summary of the activity for RSUs as of December 31, 2008, 2007 and 2006, and
changes during the years then ended, is presented below (shares in thousands):
2008 2007 2006
Nonvested Restricted Stock Units Shares
Weighted
Average Grant
Date Fair
Value Shares
Weighted
Average Grant
Date Fair
Value Shares
Weighted
Average Grant
Date Fair
Value
Outstanding at January 1 11,696 $16.78 8,635 $15.71 5,491 $ 15.69
Granted 5,923 13.63 4,444 18.17 4,256 15.18
Vested (3,350) 16.92 (935) 13.65 (686) 13.70
Cancelled (232) 15.98 (448) 16.42 (426) 13.45
Outstanding at December 31 14,037 $15.43 11,696 $16.78 8,635 $15.71
At December 31, 2008, the aggregate intrinsic value of RSUs
outstanding was $112. The total intrinsic value of RSUs vested
during 2008, 2007 and 2006 was $54, $16 and $10, respectively.
The actual tax benefit realized for the tax deductions for vested
RSUs totaled $18, $3 and $3 for the years ended December 31,
2008, 2007 and 2006, respectively.
At December 31, 2008, there was $105 of total unrecognized
compensation cost related to nonvested RSUs, which is expected to
be recognized ratably over a remaining weighted-average
contractual term of 1.6 years.
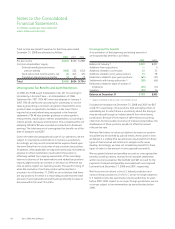
Performance shares: We grant officers and selected executives
PSs whose vesting is contingent upon meeting pre-determined
Diluted Earnings per Share (“EPS”) and Core Cash Flow from
Operations targets. These shares entitle the holder to one share of
common stock, payable after a three-year period and the
attainment of the stated goals. If the cumulative three-year actual
results for EPS and Cash Flow from Operations exceed the stated
targets, then the plan participants have the potential to earn
additional shares of common stock. This overachievement can not
exceed 50% for officers and 25% for non-officers of the original
grant.
Xerox 2008 Annual Report 87