UPS 2012 Annual Report Download - page 87
Download and view the complete annual report
Please find page 87 of the 2012 UPS annual report below. You can navigate through the pages in the report by either clicking on the pages listed below, or by using the keyword search tool below to find specific information within the annual report.-
 1
1 -
2
-
3
-
4
-
5
-
6
-
7
-
8
-
9
-
10
-
11
-
12
-
13
-
14
-
15
-
16
-
17
-
18
-
19
-
20
-
21
-
22
-
23
-
24
-
25
-
26
-
27
-
28
-
29
-
30
-
31
-
32
-
33
-
34
-
35
-
36
-
37
-
38
-
39
-
40
-
41
-
42
-
43
-
44
-
45
-
46
-
47
-
48
-
49
-
50
-
51
-
52
-
53
-
54
-
55
-
56
-
57
-
58
-
59
-
60
-
61
-
62
-
63
-
64
-
65
-
66
-
67
-
68
-
69
-
70
-
71
-
72
-
73
-
74
-
75
-
76
-
 77
77 -
 78
78 -
 79
79 -
 80
80 -
 81
81 -
 82
82 -
 83
83 -
 84
84 -
 85
85 -
 86
86 -
 87
87 -
 88
88 -
 89
89 -
 90
90 -
 91
91 -
 92
92 -
 93
93 -
 94
94 -
 95
95 -
 96
96 -
 97
97 -
98
-
99
-
100
-
101
-
102
-
103
-
104
-
105
-
106
-
107
-
108
-
109
-
110
-
111
-
112
-
113
-
114
-
115
-
116
-
117
-
118
-
119
-
120
-
121
-
122
-
123
-
124
-
125
-
126
-
127
 |
 |

UNITED PARCEL SERVICE, INC. AND SUBSIDIARIES
NOTES TO CONSOLIDATED FINANCIAL STATEMENTS
75
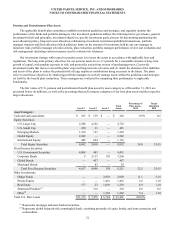
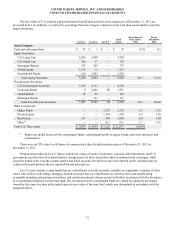
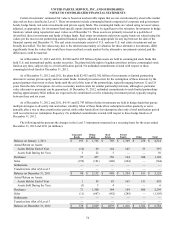
The fair value disclosures above have not been provided for our international pension benefit plans since asset allocations
are determined and managed at the individual country level. In general, the asset allocations for these plans were approximately
56% in equity securities, 34% in debt securities and 10% in other securities in 2012 (approximately 55%, 35%, and 10% in
2011, respectively). The amount of assets having significant unobservable inputs (Level 3), if any, in these plans would be
immaterial to our financial statements.
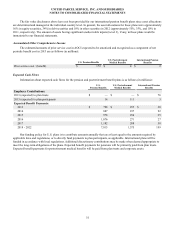
Accumulated Other Comprehensive Income
The estimated amounts of prior service cost in AOCI expected to be amortized and recognized as a component of net
periodic benefit cost in 2013 are as follows (in millions):
U.S. Pension Benefits
U.S. Postretirement
Medical Benefits
International Pension
Benefits
Prior service cost / (benefit) $ 172 $ 4 $ 2
Expected Cash Flows
Information about expected cash flows for the pension and postretirement benefit plans is as follows (in millions):
U.S.
Pension Benefits
U.S. Postretirement
Medical Benefits
International Pension
Benefits
Employer Contributions:
2013 (expected) to plan trusts $ — $ — $ 76
2013 (expected) to plan participants 14 111 3
Expected Benefit Payments:
2013 $ 798 $ 255 $ 20
2014 887 237 22
2015 978 254 25
2016 1,076 271 27
2017 1,182 288 30
2018 - 2022 7,815 1,575 199
Our funding policy for U.S. plans is to contribute amounts annually that are at least equal to the amounts required by
applicable laws and regulations, or to directly fund payments to plan participants, as applicable. International plans will be
funded in accordance with local regulations. Additional discretionary contributions may be made when deemed appropriate to
meet the long-term obligations of the plans. Expected benefit payments for pensions will be primarily paid from plan trusts.
Expected benefit payments for postretirement medical benefits will be paid from plan trusts and corporate assets.