UPS 2012 Annual Report Download - page 48
Download and view the complete annual report
Please find page 48 of the 2012 UPS annual report below. You can navigate through the pages in the report by either clicking on the pages listed below, or by using the keyword search tool below to find specific information within the annual report.-
 1
1 -
2
-
3
-
4
-
5
-
6
-
7
-
8
-
9
-
10
-
11
-
12
-
13
-
14
-
15
-
16
-
17
-
18
-
19
-
20
-
21
-
22
-
23
-
24
-
25
-
26
-
27
-
28
-
29
-
30
-
31
-
32
-
33
-
34
-
35
-
36
-
37
-
 38
38 -
 39
39 -
 40
40 -
 41
41 -
 42
42 -
 43
43 -
 44
44 -
 45
45 -
 46
46 -
 47
47 -
 48
48 -
 49
49 -
 50
50 -
 51
51 -
 52
52 -
 53
53 -
 54
54 -
 55
55 -
 56
56 -
 57
57 -
 58
58 -
59
-
60
-
61
-
62
-
63
-
64
-
65
-
66
-
67
-
68
-
69
-
70
-
71
-
72
-
73
-
74
-
75
-
76
-
77
-
78
-
79
-
80
-
81
-
82
-
83
-
84
-
85
-
86
-
87
-
88
-
89
-
90
-
91
-
92
-
93
-
94
-
95
-
96
-
97
-
98
-
99
-
100
-
101
-
102
-
103
-
104
-
105
-
106
-
107
-
108
-
109
-
110
-
111
-
112
-
113
-
114
-
115
-
116
-
117
-
118
-
119
-
120
-
121
-
122
-
123
-
124
-
125
-
126
-
127
 |
 |
UNITED PARCEL SERVICE, INC. AND SUBSIDIARIES
MANAGEMENT'S DISCUSSION AND ANALYSIS OF FINANCIAL CONDITION AND
RESULTS OF OPERATIONS
36
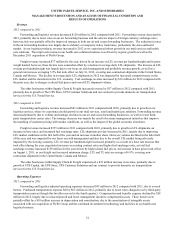
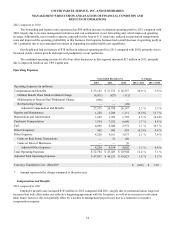
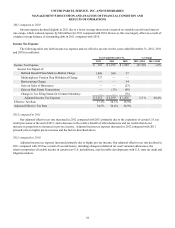
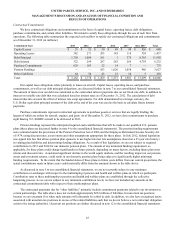
Depreciation and Amortization
2012 compared to 2011
The increase in depreciation and amortization expense was primarily due to higher depreciation expense on vehicles of
$57 million in 2012 compared with 2011, resulting from the replacement of older, fully-depreciated vehicles, technology
upgrades on new vehicles and an overall increase in the size of our vehicle fleet in our U.S. Domestic package operations.
2011 compared to 2010
The decrease in depreciation and amortization expense in 2011 was primarily the result of a reduction in depreciation
expense on technology equipment and software. This decline was primarily related to certain technology hardware and
capitalized software becoming fully depreciated.
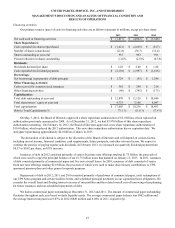
Purchased Transportation
2012 compared to 2011
The increase in purchased transportation expense charged to us by third-party air, ocean and truck carriers in 2012
compared with 2011 was impacted by several factors. We incurred a $187 million increase in purchased transportation expense
for 2012 in our U.S. Domestic Package segment, primarily due to higher fees paid to the U.S. Postal Service associated with
the strong volume growth in our SurePost product, and higher rates passed to us from rail carriers. This was partially offset by
a $65 million decrease in expense in our freight forwarding business, largely as a result of lower rates charged to us by third-
party air carriers.
2011 compared to 2010
The increase in purchased transportation in 2011 was caused by a combination of higher volume, as well as increased fuel
surcharges and base rates charged to us by third-party air, ocean and truck carriers across all segments. The combination of
these factors increased expense by $387 million in 2011. Additionally, we incurred a $97 million increase in expense in 2011
for the use of rail carriers, which was due primarily to higher rates and fuel surcharges, as well as increased volumes. The
remaining increase in expense for 2011 was primarily due to foreign currency exchange rate changes.
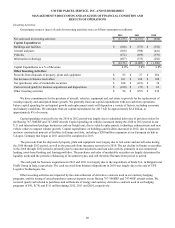
Fuel
2012 compared to 2011
The fuel expense increase in 2012 compared with 2011 was largely due to higher fuel prices, which increased expense by
$116 million; however, this was partially offset by lower usage of fuel products, which decreased expense by $72 million. The
lower fuel usage was largely due to the decrease in total aircraft block hours and vehicle miles driven.
2011 compared to 2010
The increase in fuel expense in 2011 compared with 2010 was primarily caused by higher prices for jet-A fuel, diesel and
unleaded gasoline, which increased expense by $982 million. Higher usage of these products in our operations accounted for
the remaining increase in expense of $92 million in 2011.
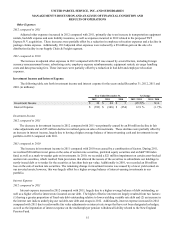
Other Occupancy
2012 compared to 2011
Other occupancy expense decreased in 2012 compared with 2011, primarily due to reductions in personal property and
real estate taxes combined with a decrease in utilities expense. The relatively warm winter in the United States, combined with
lower natural gas prices, helped to reduce heating and snow removal costs in our facilities during the early months of 2012.
2011 compared to 2010
Other occupancy expense increased in 2011 compared with 2010, primarily due to an increase in utilities expense
resulting from increased electricity costs in our facilities. The remainder of the increase is primarily due to higher rent expense
resulting from increased rates on warehouses.