UPS 2012 Annual Report Download - page 33
Download and view the complete annual report
Please find page 33 of the 2012 UPS annual report below. You can navigate through the pages in the report by either clicking on the pages listed below, or by using the keyword search tool below to find specific information within the annual report.-
 1
1 -
2
-
3
-
4
-
5
-
6
-
7
-
8
-
9
-
10
-
11
-
12
-
13
-
14
-
15
-
16
-
17
-
18
-
19
-
20
-
21
-
22
-
 23
23 -
 24
24 -
 25
25 -
 26
26 -
 27
27 -
 28
28 -
 29
29 -
 30
30 -
 31
31 -
 32
32 -
 33
33 -
 34
34 -
 35
35 -
 36
36 -
 37
37 -
 38
38 -
 39
39 -
 40
40 -
 41
41 -
 42
42 -
 43
43 -
44
-
45
-
46
-
47
-
48
-
49
-
50
-
51
-
52
-
53
-
54
-
55
-
56
-
57
-
58
-
59
-
60
-
61
-
62
-
63
-
64
-
65
-
66
-
67
-
68
-
69
-
70
-
71
-
72
-
73
-
74
-
75
-
76
-
77
-
78
-
79
-
80
-
81
-
82
-
83
-
84
-
85
-
86
-
87
-
88
-
89
-
90
-
91
-
92
-
93
-
94
-
95
-
96
-
97
-
98
-
99
-
100
-
101
-
102
-
103
-
104
-
105
-
106
-
107
-
108
-
109
-
110
-
111
-
112
-
113
-
114
-
115
-
116
-
117
-
118
-
119
-
120
-
121
-
122
-
123
-
124
-
125
-
126
-
127
 |
 |

21
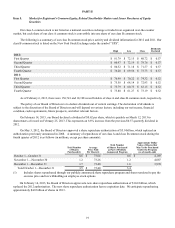
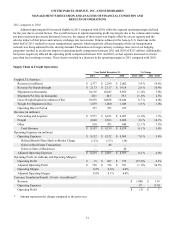
Item 6. Selected Financial Data
The following table sets forth selected financial data for each of the five years in the period ended December 31, 2012 (in
millions, except per share amounts). This financial data should be read together with our consolidated financial statements and
related notes, Management’s Discussion and Analysis of Financial Condition and Results of Operations, and other financial
data appearing elsewhere in this report.
Years Ended December 31,
2012 2011 2010 2009 2008
Selected Income Statement Data
Revenue:
U.S. Domestic Package $ 32,856 $ 31,717 $ 29,742 $ 28,158 $ 31,278
International Package 12,124 12,249 11,133 9,699 11,293
Supply Chain & Freight 9,147 9,139 8,670 7,440 8,915
Total revenue 54,127 53,105 49,545 45,297 51,486
Operating expenses:
Compensation and benefits 33,102 27,575 26,557 25,933 29,826
Other 19,682 19,450 17,347 15,856 20,041
Total operating expenses 52,784 47,025 43,904 41,789 49,867
Operating profit (loss):
U.S. Domestic Package 459 3,764 3,238 1,919 823
International Package 869 1,709 1,831 1,279 1,246
Supply Chain and Freight 15 607 572 310 (450)
Total operating profit 1,343 6,080 5,641 3,508 1,619
Other income (expense):
Investment income 24 44 3 10 75
Interest expense (393)(348)(354)(445)(442)
Income before income taxes 974 5,776 5,290 3,073 1,252
Income tax expense 167 1,972 1,952 1,105 597
Net income $ 807 $ 3,804 $ 3,338 $ 1,968 $ 655
Per share amounts:
Basic earnings per share $ 0.84 $ 3.88 $ 3.36 $ 1.97 $ 0.64
Diluted earnings per share $ 0.83 $ 3.84 $ 3.33 $ 1.96 $ 0.64
Dividends declared per share $ 2.28 $ 2.08 $ 1.88 $ 1.80 $ 1.80
Weighted average shares outstanding:
Basic 960 981 994 998 1,016
Diluted 969 991 1,003 1,004 1,022
As of December 31,
2012 2011 2010 2009 2008
Selected Balance Sheet Data
Cash and marketable securities $ 7,924 $ 4,275 $ 4,081 $ 2,100 $ 1,049
Total assets 38,863 34,701 33,597 31,883 31,879
Long-term debt 11,089 11,095 10,491 8,668 7,797
Shareowners’ equity 4,733 7,108 8,047 7,696 6,780