UPS 2012 Annual Report Download - page 79
Download and view the complete annual report
Please find page 79 of the 2012 UPS annual report below. You can navigate through the pages in the report by either clicking on the pages listed below, or by using the keyword search tool below to find specific information within the annual report.-
 1
1 -
2
-
3
-
4
-
5
-
6
-
7
-
8
-
9
-
10
-
11
-
12
-
13
-
14
-
15
-
16
-
17
-
18
-
19
-
20
-
21
-
22
-
23
-
24
-
25
-
26
-
27
-
28
-
29
-
30
-
31
-
32
-
33
-
34
-
35
-
36
-
37
-
38
-
39
-
40
-
41
-
42
-
43
-
44
-
45
-
46
-
47
-
48
-
49
-
50
-
51
-
52
-
53
-
54
-
55
-
56
-
57
-
58
-
59
-
60
-
61
-
62
-
63
-
64
-
65
-
66
-
67
-
68
-
 69
69 -
 70
70 -
 71
71 -
 72
72 -
 73
73 -
 74
74 -
 75
75 -
 76
76 -
 77
77 -
 78
78 -
 79
79 -
 80
80 -
 81
81 -
 82
82 -
 83
83 -
 84
84 -
 85
85 -
 86
86 -
 87
87 -
 88
88 -
 89
89 -
90
-
91
-
92
-
93
-
94
-
95
-
96
-
97
-
98
-
99
-
100
-
101
-
102
-
103
-
104
-
105
-
106
-
107
-
108
-
109
-
110
-
111
-
112
-
113
-
114
-
115
-
116
-
117
-
118
-
119
-
120
-
121
-
122
-
123
-
124
-
125
-
126
-
127
 |
 |
UNITED PARCEL SERVICE, INC. AND SUBSIDIARIES
NOTES TO CONSOLIDATED FINANCIAL STATEMENTS
67
The following table presents the changes in the above Level 3 instruments measured on a recurring basis for the years
ended December 31, 2012 and 2011 (in millions).
Marketable
Securities
Other
Investments Total
Balance on January 1, 2011 $ 138 $ 267 $ 405
Transfers into (out of) Level 3 — — —
Net realized and unrealized gains (losses):
Included in earnings (in investment income) — (50)(50)
Included in accumulated other comprehensive income (pre-tax) — — —
Purchases — — —
Settlements (138) — (138)
Balance on December 31, 2011 $ — $ 217 $ 217
Transfers into (out of) Level 3 — — —
Net realized and unrealized gains (losses):
Included in earnings (in investment income) — (54)(54)
Included in accumulated other comprehensive income (pre-tax) — — —
Purchases — — —
Settlements — — —
Balance on December 31, 2012 $ — $ 163 $ 163
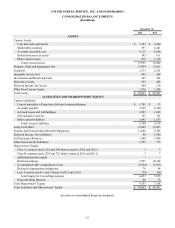
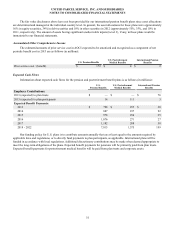
NOTE 3. PROPERTY, PLANT AND EQUIPMENT
Property, plant and equipment, including both owned assets as well as assets subject to capital leases, consists of the
following as of December 31 (in millions):
2012 2011
Vehicles $ 6,344 $ 5,981
Aircraft 15,164 14,616
Land 1,122 1,114
Buildings 3,138 3,095
Building and leasehold improvements 3,049 2,943
Plant equipment 7,010 6,803
Technology equipment 1,675 1,593
Equipment under operating leases 69 93
Construction-in-progress 470 303
38,041 36,541
Less: Accumulated depreciation and amortization (20,147)(18,920)
$ 17,894 $ 17,621
We continually monitor our aircraft fleet utilization in light of current and projected volume levels, aircraft fuel prices
and other factors. Additionally, we monitor our other property, plant and equipment categories for any indicators that the
carrying value of the assets exceed the fair value. In 2012, 2011 and 2010, there were no indicators of impairment in our
property, plant and equipment, and no impairment charges were recorded in any period.