UPS 2012 Annual Report Download - page 38
Download and view the complete annual report
Please find page 38 of the 2012 UPS annual report below. You can navigate through the pages in the report by either clicking on the pages listed below, or by using the keyword search tool below to find specific information within the annual report.-
 1
1 -
2
-
3
-
4
-
5
-
6
-
7
-
8
-
9
-
10
-
11
-
12
-
13
-
14
-
15
-
16
-
17
-
18
-
19
-
20
-
21
-
22
-
23
-
24
-
25
-
26
-
27
-
 28
28 -
 29
29 -
 30
30 -
 31
31 -
 32
32 -
 33
33 -
 34
34 -
 35
35 -
 36
36 -
 37
37 -
 38
38 -
 39
39 -
 40
40 -
 41
41 -
 42
42 -
 43
43 -
 44
44 -
 45
45 -
 46
46 -
 47
47 -
 48
48 -
49
-
50
-
51
-
52
-
53
-
54
-
55
-
56
-
57
-
58
-
59
-
60
-
61
-
62
-
63
-
64
-
65
-
66
-
67
-
68
-
69
-
70
-
71
-
72
-
73
-
74
-
75
-
76
-
77
-
78
-
79
-
80
-
81
-
82
-
83
-
84
-
85
-
86
-
87
-
88
-
89
-
90
-
91
-
92
-
93
-
94
-
95
-
96
-
97
-
98
-
99
-
100
-
101
-
102
-
103
-
104
-
105
-
106
-
107
-
108
-
109
-
110
-
111
-
112
-
113
-
114
-
115
-
116
-
117
-
118
-
119
-
120
-
121
-
122
-
123
-
124
-
125
-
126
-
127
 |
 |

UNITED PARCEL SERVICE, INC. AND SUBSIDIARIES
MANAGEMENT'S DISCUSSION AND ANALYSIS OF FINANCIAL CONDITION AND
RESULTS OF OPERATIONS
26
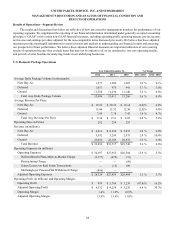
Revenue per piece for our Next Day Air and deferred products decreased in 2012 compared with 2011, as declines in fuel
surcharge rates and product mix changes more than offset the impact of a base rate increase that took effect in early 2012.
Changes in product mix negatively impacted revenue per piece for our air products, as our lightweight service offerings
accounted for a larger portion of our overall air volume in 2012 compared with 2011, and our Next Day Air Saver volume
continued to grow at a faster rate than our premium Next Day Air services.
Ground revenue per piece increased in 2012 compared with 2011, primarily due to a base rate increase that took effect in
early 2012; however, this was partially offset by product mix changes, as strong volume growth in our lightweight service
offerings resulted in these relatively lower-yielding products accounting for a greater portion of our overall volume in 2012,
compared with 2011.
Revenue per piece for our ground and air products was positively impacted by an increase in base rates that took effect on
January 2, 2012. We increased the base rates 6.9% on UPS Next Day Air, UPS 2nd Day Air and UPS 3 Day Select, and 5.9%
on UPS Ground, while reducing our fuel surcharge indices (discussed further below). Other pricing changes included an
increase in the residential surcharge, and an increase in the delivery area surcharge on certain residential and commercial
services. These rate changes are customary and occur on an annual basis.
2011 compared to 2010
Overall revenue per piece increased for our ground and air products during 2011 due to a combination of base price
increases and fuel surcharge rate changes, which are discussed further below. The overall revenue per piece increase was also
positively affected by our focus on revenue management initiatives. In addition, the revenue per piece increase for our air
products was positively impacted by the overall mix shift from letters to packages. Comparing the fourth quarter of 2011 with
2010, the average revenue per piece increase slowed to 3.4% due to the higher volume of lighter-weight business-to-consumer
packages.
Revenue per piece for our ground and air products was also impacted by an increase in base rates that took effect on
January 3, 2011. We increased the base rates 6.9% on UPS Next Day Air, UPS 2nd Day Air, and UPS 3 Day Select, and 5.9%
on UPS Ground, while reducing our fuel surcharge indices (discussed further below). Other pricing changes included an
increase in the residential surcharge, and an increase in the delivery area surcharge on both residential and commercial services
to certain ZIP codes.
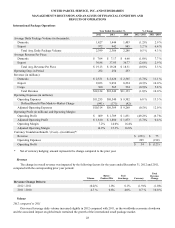
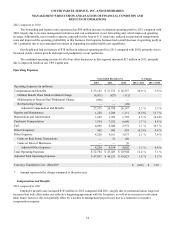
Fuel Surcharges
UPS applies a fuel surcharge on our domestic air and ground services. The air fuel surcharge is based on the U.S.
Department of Energy’s (“DOE”) Gulf Coast spot price for a gallon of kerosene-type jet fuel, while the ground fuel surcharge is
based on the DOE’s On-Highway Diesel Fuel Price. Based on published rates, the average fuel surcharge rates for domestic air
and ground products were as follows:
Year Ended December 31, % Point Change
2012 2011 2010 2012 / 2011 2011 / 2010
Next Day Air / Deferred 13.0% 13.3% 8.0% (0.3)% 5.3%
Ground 8.0% 8.0% 5.6% — % 2.4%
In connection with our base rate increases on January 2, 2012 and January 3, 2011, we modified the fuel surcharge on air
and ground services by reducing the index used to determine the fuel surcharge by 2% and 1%, respectively, each year. In
2012, these index reductions offset the increase in jet and diesel fuel prices, resulting in a small decrease in the average air fuel
surcharge rate and no change in the average ground surcharge rate. The 2011 increases in the air and ground fuel surcharge
rates were due to the significant increases in jet and diesel fuel prices, but partially offset by the reductions in the index on both
the air and ground surcharges. Total domestic fuel surcharge revenue increased $54 and $884 million in 2012 and 2011,
respectively, primarily due to volume growth in 2012 and the higher fuel surcharge rates in 2011.