UPS 2012 Annual Report Download - page 104
Download and view the complete annual report
Please find page 104 of the 2012 UPS annual report below. You can navigate through the pages in the report by either clicking on the pages listed below, or by using the keyword search tool below to find specific information within the annual report.-
 1
1 -
2
-
3
-
4
-
5
-
6
-
7
-
8
-
9
-
10
-
11
-
12
-
13
-
14
-
15
-
16
-
17
-
18
-
19
-
20
-
21
-
22
-
23
-
24
-
25
-
26
-
27
-
28
-
29
-
30
-
31
-
32
-
33
-
34
-
35
-
36
-
37
-
38
-
39
-
40
-
41
-
42
-
43
-
44
-
45
-
46
-
47
-
48
-
49
-
50
-
51
-
52
-
53
-
54
-
55
-
56
-
57
-
58
-
59
-
60
-
61
-
62
-
63
-
64
-
65
-
66
-
67
-
68
-
69
-
70
-
71
-
72
-
73
-
74
-
75
-
76
-
77
-
78
-
79
-
80
-
81
-
82
-
83
-
84
-
85
-
86
-
87
-
88
-
89
-
90
-
91
-
92
-
93
-
 94
94 -
 95
95 -
 96
96 -
 97
97 -
 98
98 -
 99
99 -
 100
100 -
 101
101 -
 102
102 -
 103
103 -
 104
104 -
 105
105 -
 106
106 -
 107
107 -
 108
108 -
 109
109 -
 110
110 -
 111
111 -
 112
112 -
 113
113 -
 114
114 -
115
-
116
-
117
-
118
-
119
-
120
-
121
-
122
-
123
-
124
-
125
-
126
-
127
 |
 |

UNITED PARCEL SERVICE, INC. AND SUBSIDIARIES
NOTES TO CONSOLIDATED FINANCIAL STATEMENTS
92
Expected volatilities are based on the historical returns on our stock and the implied volatility of our publicly-traded
options. The expected dividend yield is based on the recent historical dividend yields for our stock, taking into account changes
in dividend policy. The risk-free interest rate is based on the term structure of interest rates at the time of the option grant. The
expected life represents an estimate of the period of time options are expected to remain outstanding, and we have relied upon a
combination of the observed exercise behavior of our prior grants with similar characteristics, the vesting schedule of the
grants, and an index of peer companies with similar grant characteristics in estimating this variable.
We received cash of $122, $92 and $60 million during 2012, 2011 and 2010, respectively, from option holders resulting
from the exercise of stock options. We received a tax benefit of $3, $6 and $4 million during 2012, 2011 and 2010, respectively,
from the exercise of stock options, which is reported as cash from financing activities in the cash flow statement.
The total intrinsic value of options exercised during 2012, 2011 and 2010 was $39, $31 and $18 million, respectively. As
of December 31, 2012, there was $2 million of total unrecognized compensation cost related to nonvested options. That cost is
expected to be recognized over a weighted average period of 3 years and 4 months.
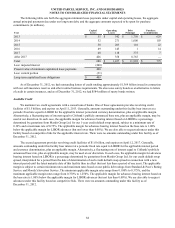
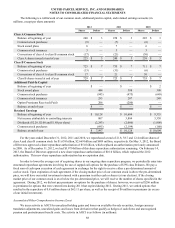
The following table summarizes information about stock options outstanding and exercisable at December 31, 2012:
Options Outstanding Options Exercisable
Exercise Price Range
Shares
(in thousands)
Average Life
(in years)
Average
Exercise
Price
Shares
(in thousands)
Average
Exercise
Price
$50.01 - $60.00 211 6.35 $ 55.83 133 $ 55.83
$60.01 - $70.00 1,337 1.20 62.98 1,257 62.72
$70.01 - $80.00 6,858 3.19 71.47 6,536 71.27
$80.01 - $90.00 2,189 3.33 80.92 2,189 80.92
10,595 3.03 $ 72.04 10,115 $ 72.09
Discounted Employee Stock Purchase Plan
We maintain an employee stock purchase plan for all eligible employees. Under this plan, shares of UPS class A common
stock may be purchased at quarterly intervals at 95% of the NYSE closing price of UPS class B common stock on the last day
of each quarterly period. Employees purchased 1.2, 1.3 and 1.5 million shares at average prices of $72.17, $66.86 and $57.98
per share during 2012, 2011, and 2010, respectively. This plan is not considered to be compensatory, and therefore no
compensation cost is measured for the employees’ purchase rights.
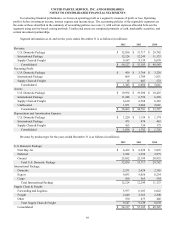
NOTE 11. SEGMENT AND GEOGRAPHIC INFORMATION
We report our operations in three segments: U.S. Domestic Package operations, International Package operations and
Supply Chain & Freight operations. Package operations represent our most significant business and are broken down into
regional operations around the world. Regional operations managers are responsible for both domestic and export operations
within their geographic area.
U.S. Domestic Package
Domestic Package operations include the time-definite delivery of letters, documents and packages throughout the United
States.
International Package
International Package operations include delivery to more than 220 countries and territories worldwide, including
shipments wholly outside the United States, as well as shipments with either origin or destination outside the United States. Our
International Package reporting segment includes the operations of our Europe, Asia and Americas operating segments.
Supply Chain & Freight
Supply Chain & Freight includes our forwarding and logistics operations, UPS Freight and other aggregated business
units. Our forwarding and logistics business provides services in more than 195 countries and territories worldwide, and
includes supply chain design and management, freight distribution, customs brokerage, mail and consulting services. UPS
Freight offers a variety of LTL and TL services to customers in North America. Other aggregated business units within this
segment include Mail Boxes Etc. (the franchisor of Mail Boxes Etc. and The UPS Store) and UPS Capital.