UPS 2012 Annual Report Download - page 37
Download and view the complete annual report
Please find page 37 of the 2012 UPS annual report below. You can navigate through the pages in the report by either clicking on the pages listed below, or by using the keyword search tool below to find specific information within the annual report.-
 1
1 -
2
-
3
-
4
-
5
-
6
-
7
-
8
-
9
-
10
-
11
-
12
-
13
-
14
-
15
-
16
-
17
-
18
-
19
-
20
-
21
-
22
-
23
-
24
-
25
-
26
-
 27
27 -
 28
28 -
 29
29 -
 30
30 -
 31
31 -
 32
32 -
 33
33 -
 34
34 -
 35
35 -
 36
36 -
 37
37 -
 38
38 -
 39
39 -
 40
40 -
 41
41 -
 42
42 -
 43
43 -
 44
44 -
 45
45 -
 46
46 -
 47
47 -
48
-
49
-
50
-
51
-
52
-
53
-
54
-
55
-
56
-
57
-
58
-
59
-
60
-
61
-
62
-
63
-
64
-
65
-
66
-
67
-
68
-
69
-
70
-
71
-
72
-
73
-
74
-
75
-
76
-
77
-
78
-
79
-
80
-
81
-
82
-
83
-
84
-
85
-
86
-
87
-
88
-
89
-
90
-
91
-
92
-
93
-
94
-
95
-
96
-
97
-
98
-
99
-
100
-
101
-
102
-
103
-
104
-
105
-
106
-
107
-
108
-
109
-
110
-
111
-
112
-
113
-
114
-
115
-
116
-
117
-
118
-
119
-
120
-
121
-
122
-
123
-
124
-
125
-
126
-
127
 |
 |

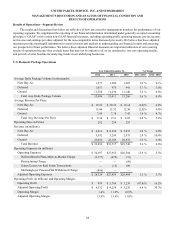
UNITED PARCEL SERVICE, INC. AND SUBSIDIARIES
MANAGEMENT'S DISCUSSION AND ANALYSIS OF FINANCIAL CONDITION AND
RESULTS OF OPERATIONS
25
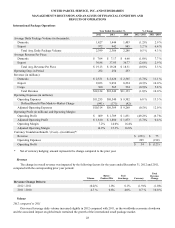
Revenue
The change in overall revenue was impacted by the following factors for the years ended December 31, 2012 and 2011,
compared with the corresponding prior year periods:
Volume
Rates /
Product Mix
Fuel
Surcharge
Total
Revenue
Change
Revenue Change Drivers:
2012 / 2011 2.8% 0.6% 0.2% 3.6%
2011 / 2010 1.3% 2.3% 3.0% 6.6%
Volume
2012 compared to 2011
Our overall volume increased in 2012 compared with 2011, largely due to continued solid growth in retail e-commerce
and strong customer demand for our lightweight products. Business-to-consumer shipments, which represent slightly over 40%
of total U.S. Domestic Package volume, grew rapidly and drove growth in both air and ground shipments; however, business-
to-business volume remained relatively flat in 2012 compared with 2011. This can be attributed to multiple trends that have
prevailed over the past few years, including the migration of traditional retail to online retail, the lack of growth in small and
medium-size enterprises and reduced business investments attributed to policy uncertainty.
Among our air products, Next Day Air letter and package volume both experienced solid increases in 2012, with
particular growth in our Next Day Air Saver products. The higher volume for our deferred air products, which increased 5.7%
for the year, was primarily due to healthy demand for our residential package services. The overall growth in our air products
was driven primarily by business-to-consumer shipments from e-commerce retailers, while our business-to-business air volume
declined slightly.
The increase in ground volume in 2012 was driven by our lightweight service offerings, including SurePost, which target
low-cost, non-urgent residential deliveries. Volume for these lightweight products grew significantly, and accounted for
approximately 40% of the total increase in ground shipments. Outside of these lightweight service offerings, volume for our
traditional ground residential services also experienced an increase in 2012. Overall ground volume growth continues to be
driven by business-to-consumer shipping activity from e-commerce retailers, while our business-to-business ground volume
was flat in 2012 compared with 2011.
2011 compared to 2010
Our overall volume increased slightly in 2011 compared with 2010, and was largely impacted by the slowing U.S.
economy during the first three quarters of the year. Business-to-consumer shipments, which represented approximately 40% of
total U.S. Domestic Package volume, experienced stronger growth than business-to-business volume. Volume growth
accelerated in the fourth quarter, with average daily volume increasing 3.8% over the fourth quarter of 2010.
Among our air products, we experienced a 4.8% increase in Next Day and Second Day air package volume, as a result of
retail sales growth, with particular growth in our Next Day Air Saver product. Air letter volume declined, largely due to
weakness in the financial and other service industries. Within ground, our lightweight products experienced robust growth
during 2011. During the fourth quarter of 2011, volume growth accelerated to 12.3% and 3.5% in our deferred and ground
products, respectively, compared with the fourth quarter of 2010. These increases were primarily driven by higher business-to-
consumer shipment activity during the holiday season.
Rates and Product Mix
2012 compared to 2011
Overall revenue per piece increased 0.8% in 2012 compared with 2011, and was impacted by changes in base rates,
product mix and fuel surcharge rates, as discussed below.