UPS 2012 Annual Report Download - page 82
Download and view the complete annual report
Please find page 82 of the 2012 UPS annual report below. You can navigate through the pages in the report by either clicking on the pages listed below, or by using the keyword search tool below to find specific information within the annual report.-
 1
1 -
2
-
3
-
4
-
5
-
6
-
7
-
8
-
9
-
10
-
11
-
12
-
13
-
14
-
15
-
16
-
17
-
18
-
19
-
20
-
21
-
22
-
23
-
24
-
25
-
26
-
27
-
28
-
29
-
30
-
31
-
32
-
33
-
34
-
35
-
36
-
37
-
38
-
39
-
40
-
41
-
42
-
43
-
44
-
45
-
46
-
47
-
48
-
49
-
50
-
51
-
52
-
53
-
54
-
55
-
56
-
57
-
58
-
59
-
60
-
61
-
62
-
63
-
64
-
65
-
66
-
67
-
68
-
69
-
70
-
71
-
 72
72 -
 73
73 -
 74
74 -
 75
75 -
 76
76 -
 77
77 -
 78
78 -
 79
79 -
 80
80 -
 81
81 -
 82
82 -
 83
83 -
 84
84 -
 85
85 -
 86
86 -
 87
87 -
 88
88 -
 89
89 -
 90
90 -
 91
91 -
 92
92 -
93
-
94
-
95
-
96
-
97
-
98
-
99
-
100
-
101
-
102
-
103
-
104
-
105
-
106
-
107
-
108
-
109
-
110
-
111
-
112
-
113
-
114
-
115
-
116
-
117
-
118
-
119
-
120
-
121
-
122
-
123
-
124
-
125
-
126
-
127
 |
 |

UNITED PARCEL SERVICE, INC. AND SUBSIDIARIES
NOTES TO CONSOLIDATED FINANCIAL STATEMENTS
70
For plans outside the U.S., consideration is given to local market expectations of long-term returns. Strategic asset
allocations are determined by country, based on the nature of liabilities and considering the demographic composition of the
plan participants.
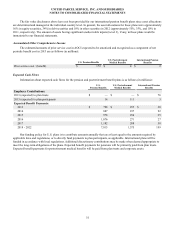
Health care cost trends are used to project future postretirement benefits payable from our plans. For year-end 2012 U.S.
plan obligations, future postretirement medical benefit costs were forecasted assuming an initial annual increase of 7.5%,
decreasing to 5.0% by the year 2018 and with consistent annual increases at those ultimate levels thereafter.
Assumed health care cost trends can have a significant effect on the amounts reported for the U.S. postretirement medical
plans. A one-percent change in assumed health care cost trend rates would have had the following effects on 2012 results (in
millions):
1% Increase 1% Decrease
Effect on total of service cost and interest cost $ 4 $ (4)
Effect on postretirement benefit obligation $ 58 $ (69)
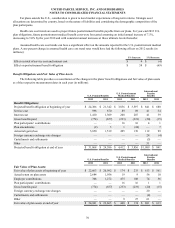
Benefit Obligations and Fair Value of Plan Assets
The following table provides a reconciliation of the changes in the plans’ benefit obligations and fair value of plan assets
as of the respective measurement dates in each year (in millions).
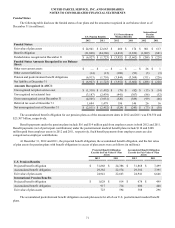
U.S. Pension Benefits
U.S. Postretirement
Medical Benefits
International
Pension
Benefits
2012 2011 2012 2011 2012 2011
Benefit Obligations:
Projected benefit obligation at beginning of year $ 24,386 $ 21,342 $ 3,836 $ 3,597 $ 841 $ 680
Service cost 998 870 89 89 41 34
Interest cost 1,410 1,309 208 207 41 39
Gross benefits paid (774)(657)(233)(219)(20)(15)
Plan participants’ contributions — — 16 16 4 1
Plan amendments (2) 3 1 (24) — 7
Actuarial (gain)/loss 5,850 1,519 495 170 112 99
Foreign currency exchange rate changes — — — — 24 (4)
Curtailments and settlements — — — — (5) —
Other — — — — 51 —
Projected benefit obligation at end of year $ 31,868 $ 24,386 $ 4,412 $ 3,836 $1,089 $ 841
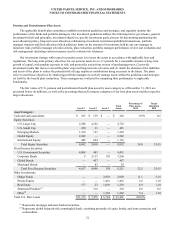
U.S. Pension Benefits
U.S. Postretirement
Medical Benefits
International
Pension
Benefits
2012 2011 2012 2011 2012 2011
Fair Value of Plan Assets:
Fair value of plan assets at beginning of year $ 22,663 $ 20,092 $ 174 $ 233 $ 613 $ 561
Actual return on plan assets 2,684 1,956 19 9 56 10
Employer contributions 368 1,272 475 108 74 56
Plan participants’ contributions — — 16 16 1 1
Gross benefits paid (774)(657)(233)(219)(20)(15)
Foreign currency exchange rate changes — — — — 20 —
Curtailments and settlements — — — — (4) —
Other — — 9 27 61 —
Fair value of plan assets at end of year $ 24,941 $ 22,663 $ 460 $ 174 $ 801 $ 613