UPS 2012 Annual Report Download - page 85
Download and view the complete annual report
Please find page 85 of the 2012 UPS annual report below. You can navigate through the pages in the report by either clicking on the pages listed below, or by using the keyword search tool below to find specific information within the annual report.-
 1
1 -
2
-
3
-
4
-
5
-
6
-
7
-
8
-
9
-
10
-
11
-
12
-
13
-
14
-
15
-
16
-
17
-
18
-
19
-
20
-
21
-
22
-
23
-
24
-
25
-
26
-
27
-
28
-
29
-
30
-
31
-
32
-
33
-
34
-
35
-
36
-
37
-
38
-
39
-
40
-
41
-
42
-
43
-
44
-
45
-
46
-
47
-
48
-
49
-
50
-
51
-
52
-
53
-
54
-
55
-
56
-
57
-
58
-
59
-
60
-
61
-
62
-
63
-
64
-
65
-
66
-
67
-
68
-
69
-
70
-
71
-
72
-
73
-
74
-
 75
75 -
 76
76 -
 77
77 -
 78
78 -
 79
79 -
 80
80 -
 81
81 -
 82
82 -
 83
83 -
 84
84 -
 85
85 -
 86
86 -
 87
87 -
 88
88 -
 89
89 -
 90
90 -
 91
91 -
 92
92 -
 93
93 -
 94
94 -
 95
95 -
96
-
97
-
98
-
99
-
100
-
101
-
102
-
103
-
104
-
105
-
106
-
107
-
108
-
109
-
110
-
111
-
112
-
113
-
114
-
115
-
116
-
117
-
118
-
119
-
120
-
121
-
122
-
123
-
124
-
125
-
126
-
127
 |
 |
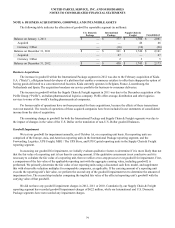
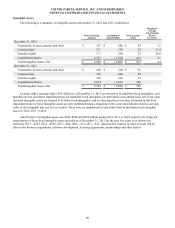
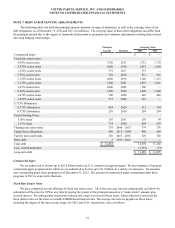
UNITED PARCEL SERVICE, INC. AND SUBSIDIARIES
NOTES TO CONSOLIDATED FINANCIAL STATEMENTS
73
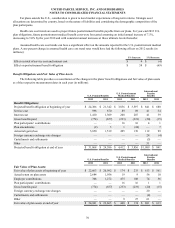
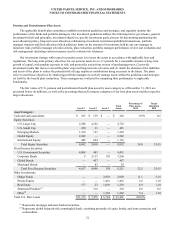
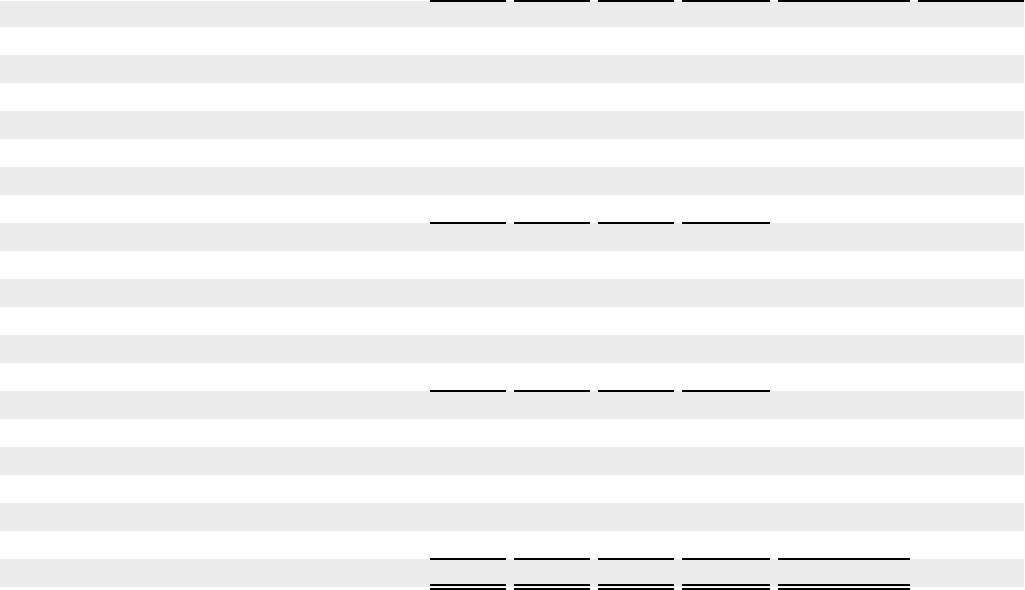
The fair values of U.S. pension and postretirement benefit plan assets by asset category as of December 31, 2011 are
presented below (in millions), as well as the percentage that each category comprises of our total plan assets and the respective
target allocations.
Level 1 Level 2 Level 3
Total
Assets
Percentage of
Plan Assets -
2011
Target
Allocation
2011
Asset Category:
Cash and cash equivalents $ 74 $ 1 $ — $ 75 0.3% 0-5
Equity Securities:
U.S. Large Cap 2,264 2,460 — 4,724
U.S. Small Cap 706 27 — 733
Emerging Markets 533 264 — 797
Global Equity 1,115 12 — 1,127
International Equity 810 1,091 — 1,901
Total Equity Securities 5,428 3,854 — 9,282 40.7 35-55
Fixed Income Securities:
U.S. Government Securities 3,374 1,131 — 4,505
Corporate Bonds 9 3,462 80 3,551
Global Bonds 38 69 — 107
Municipal Bonds — 121 — 121
Total Fixed Income Securities 3,421 4,783 80 8,284 36.3 20-40
Other Investments:
Hedge Funds — — 2,132 2,132 9.3 5-15
Private Equity — — 1,354 1,354 5.9 1-10
Real Estate 151 — 948 1,099 4.8 1-10
Other(1) — — 611 611 2.7 1-10
Total U.S. Plan Assets $ 9,074 $ 8,638 $ 5,125 $ 22,837 100.0%
(1) Represents global balanced-risk commingled funds, consisting primarily of equity, bonds, and some currencies and
commodities.
There were no UPS class A or B shares of common stock directly held in plan assets as of December 31, 2012 or
December 31, 2011.
Pension assets utilizing Level 1 inputs include fair values of equity investments, corporate debt instruments, and U.S.
government securities that were determined by closing prices for those securities traded on national stock exchanges, while
securities traded in the over-the-counter market and listed securities for which no sale was reported on the valuation date are
valued at the mean between the last reported bid and asked prices.
Level 2 assets include certain bonds that are valued based on yields currently available on comparable securities of other
issues with similar credit ratings, mortgage-backed securities that are valued based on cash flow and yield models using
acceptable modeling and pricing conventions, and certain investments that are pooled with other investments held by the trustee
in a commingled employee benefit trust fund. The investments in the commingled funds are valued by taking the percentage
owned by the respective plan in the underlying net asset value of the trust fund, which was determined in accordance with the
paragraph above.