UPS 2012 Annual Report Download - page 114
Download and view the complete annual report
Please find page 114 of the 2012 UPS annual report below. You can navigate through the pages in the report by either clicking on the pages listed below, or by using the keyword search tool below to find specific information within the annual report.-
 1
1 -
2
-
3
-
4
-
5
-
6
-
7
-
8
-
9
-
10
-
11
-
12
-
13
-
14
-
15
-
16
-
17
-
18
-
19
-
20
-
21
-
22
-
23
-
24
-
25
-
26
-
27
-
28
-
29
-
30
-
31
-
32
-
33
-
34
-
35
-
36
-
37
-
38
-
39
-
40
-
41
-
42
-
43
-
44
-
45
-
46
-
47
-
48
-
49
-
50
-
51
-
52
-
53
-
54
-
55
-
56
-
57
-
58
-
59
-
60
-
61
-
62
-
63
-
64
-
65
-
66
-
67
-
68
-
69
-
70
-
71
-
72
-
73
-
74
-
75
-
76
-
77
-
78
-
79
-
80
-
81
-
82
-
83
-
84
-
85
-
86
-
87
-
88
-
89
-
90
-
91
-
92
-
93
-
94
-
95
-
96
-
97
-
98
-
99
-
100
-
101
-
102
-
103
-
 104
104 -
 105
105 -
 106
106 -
 107
107 -
 108
108 -
 109
109 -
 110
110 -
 111
111 -
 112
112 -
 113
113 -
 114
114 -
 115
115 -
 116
116 -
 117
117 -
 118
118 -
 119
119 -
 120
120 -
 121
121 -
 122
122 -
 123
123 -
 124
124 -
125
-
126
-
127
 |
 |
UNITED PARCEL SERVICE, INC. AND SUBSIDIARIES
NOTES TO CONSOLIDATED FINANCIAL STATEMENTS
102
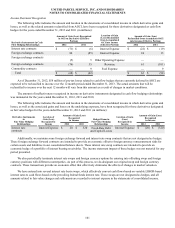
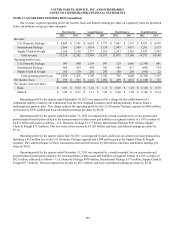
The following is a summary of the amounts recorded in the statements of consolidated income related to fair value changes
and settlements of these foreign currency forward and interest rate swap contracts not designated as hedges for the years ended
December 31, 2012 and 2011 (in millions):
Derivative Instruments Not Designated in
Hedging Relationships
Location of Gain
(Loss) Recognized
in Income
Amount of Gain (Loss)
Recognized in Income
2012 2011
Foreign exchange contracts Revenue $ 2 $ —
Foreign exchange contracts Other Operating Expenses 19 2
Foreign exchange contracts Investment Income (22) —
Interest rate contracts Interest Expense (12) (8)
Total $ (13) $ (6)
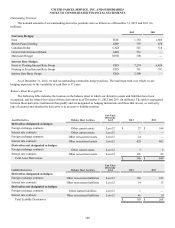
Fair Value Measurements
Our foreign currency, interest rate and energy derivatives are largely comprised of over-the-counter derivatives, which are
primarily valued using pricing models that rely on market observable inputs such as yield curves, currency exchange rates and
commodity forward prices, and therefore are classified as Level 2. The fair values of our derivative assets and liabilities as of
December 31, 2012 and 2011 by hedge type are as follows (in millions):
Quoted Prices in
Active Markets
for
Identical Assets
(Level 1)
Significant
Other
Observable
Inputs
(Level 2)
Significant
Unobservable
Inputs
(Level 3) Total
2012
Assets
Foreign Exchange Contracts $ — $ 44 $ — $ 44
Interest Rate Contracts — 522 — 522
Total $ — $ 566 $ — $ 566
Liabilities
Foreign Exchange Contracts $ — $ 104 $ — $ 104
Interest Rate Contracts — 55 — 55
Total $ — $ 159 $ — $ 159
Quoted Prices in
Active Markets
for
Identical Assets
(Level 1)
Significant
Other
Observable
Inputs
(Level 2)
Significant
Unobservable
Inputs
(Level 3) Total
2011
Assets
Foreign Exchange Contracts $ — $ 166 $ — $ 166
Interest Rate Contracts — 483 — 483
Total $ — $ 649 $ — $ 649
Liabilities
Foreign Exchange Contracts $ — $ 185 $ — $ 185
Interest Rate Contracts — 23 — 23
Total $ — $ 208 $ — $ 208