UPS 2012 Annual Report Download - page 8
Download and view the complete annual report
Please find page 8 of the 2012 UPS annual report below. You can navigate through the pages in the report by either clicking on the pages listed below, or by using the keyword search tool below to find specific information within the annual report.-
 1
1 -
 2
2 -
 3
3 -
 4
4 -
 5
5 -
 6
6 -
 7
7 -
 8
8 -
 9
9 -
 10
10 -
 11
11 -
 12
12 -
 13
13 -
 14
14 -
 15
15 -
 16
16 -
 17
17 -
 18
18 -
 19
19 -
20
-
21
-
22
-
23
-
24
-
25
-
26
-
27
-
28
-
29
-
30
-
31
-
32
-
33
-
34
-
35
-
36
-
37
-
38
-
39
-
40
-
41
-
42
-
43
-
44
-
45
-
46
-
47
-
48
-
49
-
50
-
51
-
52
-
53
-
54
-
55
-
56
-
57
-
58
-
59
-
60
-
61
-
62
-
63
-
64
-
65
-
66
-
67
-
68
-
69
-
70
-
71
-
72
-
73
-
74
-
75
-
76
-
77
-
78
-
79
-
80
-
81
-
82
-
83
-
84
-
85
-
86
-
87
-
88
-
89
-
90
-
91
-
92
-
93
-
94
-
95
-
96
-
97
-
98
-
99
-
100
-
101
-
102
-
103
-
104
-
105
-
106
-
107
-
108
-
109
-
110
-
111
-
112
-
113
-
114
-
115
-
116
-
117
-
118
-
119
-
120
-
121
-
122
-
123
-
124
-
125
-
126
-
127
 |
 |

06
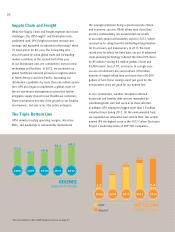
Supply Chain and Freight
While the Supply Chain and Freight segment also faced
challenges, the UPS Freight® and Distribution units
performed well. UPS Freight increased revenue and
tonnage and expanded its adjusted profit margin5 about
70 basis points for the year. The Forwarding unit
was pressured by weak global trade and forwarding
market conditions in the second half of the year.
In our Distribution unit, we continued to invest in new
technology and facilities. In 2012, we increased our
global healthcare network presence in eight locations
in North America and Asia Pacific, expanding our
distribution capabilities by more than one million square
feet. UPS also began to implement a global, state-of-
the-art warehouse management system that further
integrates supply chains for our Healthcare customers.
These investments not only drive growth in our Distribu-
tion business, but also across the entire enterprise.
The Triple Bottom Line
UPS’s industry leading operating margins, attractive
ROIC, and leadership in sustainability demonstrate
the synergies between being a good corporate citizen
and economic success. While others may claim they
practice sustainability, we documented our results
in our ninth annual sustainability report in 2012, which
received an A+ rating from the Global Reporting Initiative
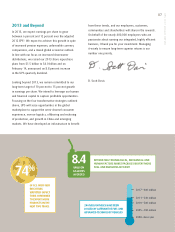
for its accuracy and transparency. In 2011, the most
recent year for which we have data, our use of advanced
route-planning technology reduced the miles UPS drove
by 85 million—saving 8.4 million gallons of fuel and
83,000 metric tons of CO2 emissions. In a single year,
our use of telematics has saved almost 100 million
minutes of engine-idling time and more than 650,000
gallons of fuel. These savings aren’t just good for the
environment, they are good for our bottom line.
In our communities, weather disruptions affected
businesses and families alike and we responded by
contributing both cash and services to those affected.
In addition, UPS employees logged more than 1.8 million
volunteer hours during 2012. On the environmental front,
we expanded our alternative fuel vehicle fleet. Our actions
earned UPS the highest score in the 2012 Carbon Disclosure
Project’s Leadership Index of S&P 500 companies.
IN BILLIONS OF DOLLARS
REVENUE
2008 2009 2010 2011 2012
54.1
53.1
49.5
45.3
51.5
5 See reconciliation of Non-GAAP financial measures on page A1.
3.7
IN BILLIONS OF DOLLARS
NET INCOME
2008 2009 2010 2011 2012
0.7
2.1
2.0
3.5
3.3
4.3
3.8
4.4
0.8
GAAP
Adjusted5