UPS 2012 Annual Report Download - page 112
Download and view the complete annual report
Please find page 112 of the 2012 UPS annual report below. You can navigate through the pages in the report by either clicking on the pages listed below, or by using the keyword search tool below to find specific information within the annual report.-
 1
1 -
2
-
3
-
4
-
5
-
6
-
7
-
8
-
9
-
10
-
11
-
12
-
13
-
14
-
15
-
16
-
17
-
18
-
19
-
20
-
21
-
22
-
23
-
24
-
25
-
26
-
27
-
28
-
29
-
30
-
31
-
32
-
33
-
34
-
35
-
36
-
37
-
38
-
39
-
40
-
41
-
42
-
43
-
44
-
45
-
46
-
47
-
48
-
49
-
50
-
51
-
52
-
53
-
54
-
55
-
56
-
57
-
58
-
59
-
60
-
61
-
62
-
63
-
64
-
65
-
66
-
67
-
68
-
69
-
70
-
71
-
72
-
73
-
74
-
75
-
76
-
77
-
78
-
79
-
80
-
81
-
82
-
83
-
84
-
85
-
86
-
87
-
88
-
89
-
90
-
91
-
92
-
93
-
94
-
95
-
96
-
97
-
98
-
99
-
100
-
101
-
 102
102 -
 103
103 -
 104
104 -
 105
105 -
 106
106 -
 107
107 -
 108
108 -
 109
109 -
 110
110 -
 111
111 -
 112
112 -
 113
113 -
 114
114 -
 115
115 -
 116
116 -
 117
117 -
 118
118 -
 119
119 -
 120
120 -
 121
121 -
 122
122 -
123
-
124
-
125
-
126
-
127
 |
 |
UNITED PARCEL SERVICE, INC. AND SUBSIDIARIES
NOTES TO CONSOLIDATED FINANCIAL STATEMENTS
100
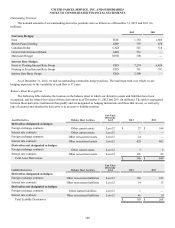
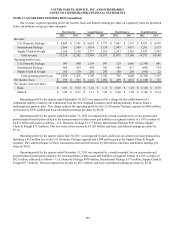
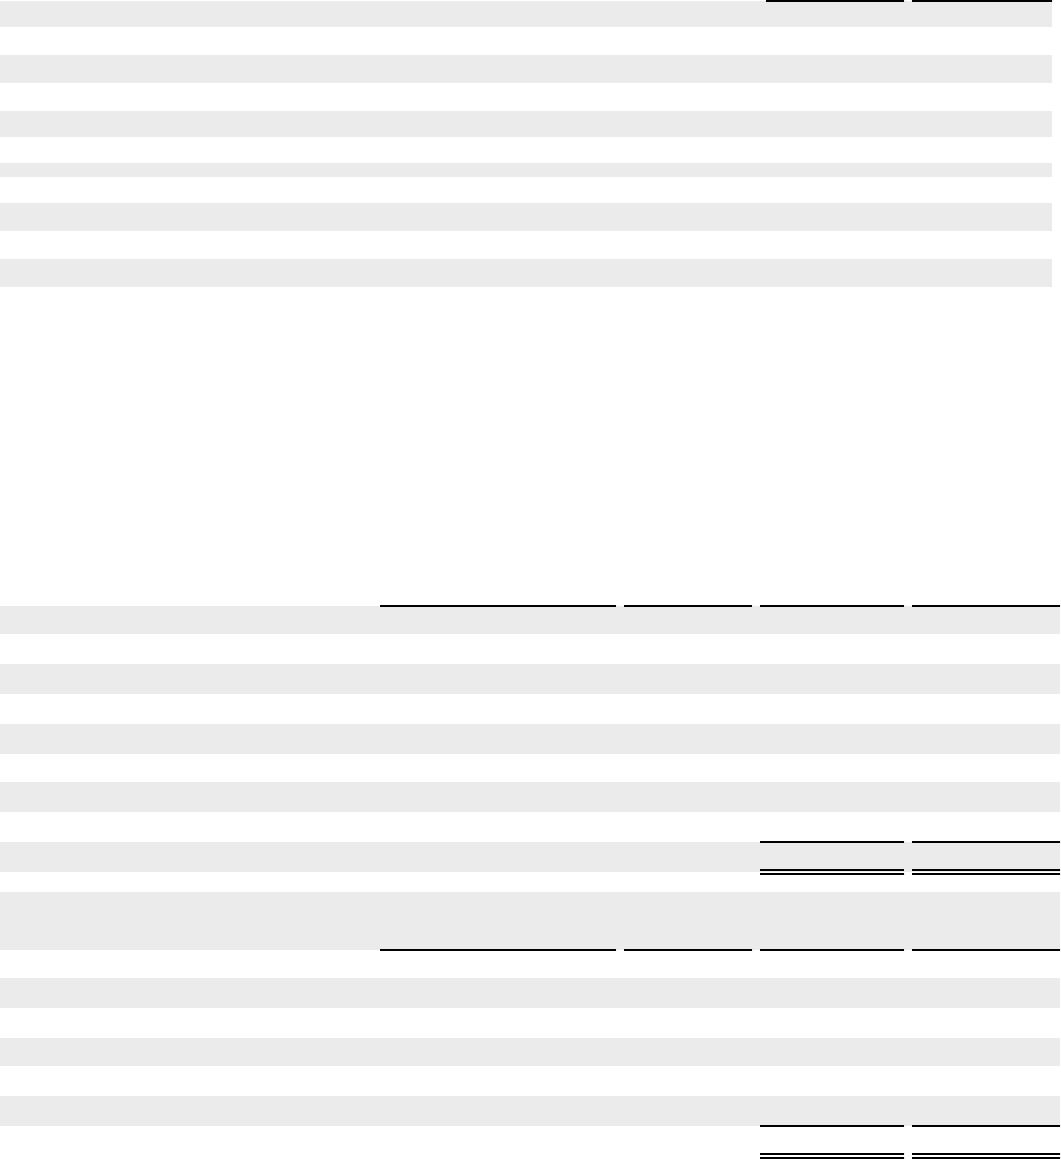
Outstanding Positions
The notional amounts of our outstanding derivative positions were as follows as of December 31, 2012 and 2011 (in
millions):
2012 2011
Currency Hedges:
Euro EUR 1,783 1,685
British Pound Sterling GBP 797 870
Canadian Dollar CAD 341 318
United Arab Emirates Dirham AED 551 —
Malaysian Ringgit MYR 500 —
Interest Rate Hedges:
Fixed to Floating Interest Rate Swaps USD 7,274 6,424
Floating to Fixed Interest Rate Swaps USD 781 791
Interest Rate Basis Swaps USD 2,500 —
As of December 31, 2012, we had no outstanding commodity hedge positions. The maximum term over which we are
hedging exposures to the variability of cash flow is 37 years.
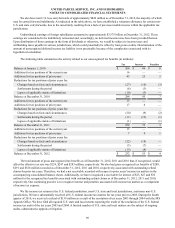
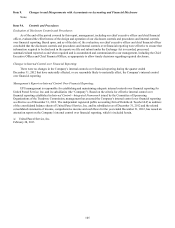
Balance Sheet Recognition
The following table indicates the location on the balance sheet in which our derivative assets and liabilities have been
recognized, and the related fair values of those derivatives as of December 31, 2012 and 2011 (in millions). The table is segregated
between those derivative instruments that qualify and are designated as hedging instruments and those that are not, as well as by
type of contract and whether the derivative is in an asset or liability position.
Asset Derivatives Balance Sheet Location
Fair Value
Hierarchy
Level 2012 2011
Derivatives designated as hedges:
Foreign exchange contracts Other current assets Level 2 $ 27 $ 164
Interest rate contracts Other current assets Level 2 1 —
Foreign exchange contracts Other non-current assets Level 2 14 —
Interest rate contracts Other non-current assets Level 2 420 401
Derivatives not designated as hedges:
Foreign exchange contracts Other current assets Level 2 3 2
Interest rate contracts Other non-current assets Level 2 101 82
Total Asset Derivatives $ 566 $ 649
Liability Derivatives Balance Sheet Location
Fair Value
Hierarchy
Level 2012 2011
Derivatives designated as hedges:
Foreign exchange contracts Other non-current liabilities Level 2 103 185
Interest rate contracts Other non-current liabilities Level 2 14 13
Derivatives not designated as hedges:
Foreign exchange contracts Other current liabilities Level 2 1 —
Interest rate contracts Other non-current liabilities Level 2 41 10
Total Liability Derivatives $ 159 $ 208