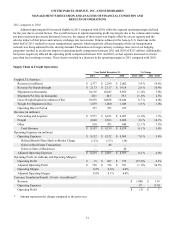
UPS 2012 Annual Report Download - page 46
Download and view the complete annual report
Please find page 46 of the 2012 UPS annual report below. You can navigate through the pages in the report by either clicking on the pages listed below, or by using the keyword search tool below to find specific information within the annual report.
UNITED PARCEL SERVICE, INC. AND SUBSIDIARIES
MANAGEMENT'S DISCUSSION AND ANALYSIS OF FINANCIAL CONDITION AND
RESULTS OF OPERATIONS
34
2011 compared to 2010
The forwarding and logistics unit experienced an $80 million increase in adjusted operating profit in 2011 compared with
2010, largely due to revenue management initiatives and cost containment in our forwarding unit, which improved operating
leverage. Additionally, excess market capacity, especially in the Asia-to-U.S. trade lane, reduced our purchased transportation
costs and improved the operating profitability in this business. Our logistics business had a small decrease in operating profit in
2011, primarily due to our continued investment in expanding our global health care capabilities.
Our freight unit had an increase of $38 million in adjusted operating profit in 2011 compared with 2010, primarily due to
increased yields, volume growth and improved productivity in our operations.
The combined operating income for all of our other businesses in this segment increased $27 million in 2011, primarily
due to improved results at our UPS Capital unit.
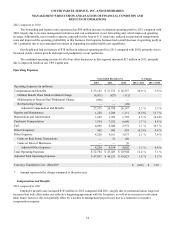
Operating Expenses
Year Ended December 31, % Change
2012 2011 2010 2012 / 2011 2011 / 2010
Operating Expenses (in millions):
Compensation and Benefits $ 33,102 $ 27,575 $ 26,557 20.0 % 3.8 %
Defined Benefit Plans Mark-to-Market Charge (4,831)(827)(112)
Multiemployer Pension Plan Withdrawal Charge (896) — —
Restructuring Charge — — (98)
Adjusted Compensation and Benefits 27,375 26,748 26,347 2.3 % 1.5 %
Repairs and Maintenance 1,228 1,286 1,131 (4.5)% 13.7 %
Depreciation and Amortization 1,858 1,782 1,792 4.3 % (0.6)%
Purchased Transportation 7,354 7,232 6,640 1.7 % 8.9 %
Fuel 4,090 4,046 2,972 1.1 % 36.1 %
Other Occupancy 902 943 939 (4.3)% 0.4 %
Other Expenses 4,250 4,161 3,873 2.1 % 7.4 %
Gains on Real Estate Transactions — 33 109
Gains on Sales of Businesses — — 20
Adjusted Other Expenses 4,250 4,194 4,002 1.3 % 4.8 %
Total Operating Expenses $ 52,784 $ 47,025 $ 43,904 12.2 % 7.1 %
Adjusted Total Operating Expenses $ 47,057 $ 46,231 $ 43,823 1.8 % 5.5 %
Currency Translation Cost / (Benefit)* $ (362) $ 330
* Amount represents the change compared to the prior year.
Compensation and Benefits
2012 compared to 2011
Employee payroll costs increased $183 million in 2012 compared with 2011, largely due to contractual union wage rate
increases that took effect under our collective bargaining agreement with the Teamsters, as well as an increase in total union
labor hours; however, this was partially offset by a decline in management payroll costs due to a reduction in incentive
compensation expense.


