UPS 2012 Annual Report Download - page 4
Download and view the complete annual report
Please find page 4 of the 2012 UPS annual report below. You can navigate through the pages in the report by either clicking on the pages listed below, or by using the keyword search tool below to find specific information within the annual report.-
 1
1 -
 2
2 -
 3
3 -
 4
4 -
 5
5 -
 6
6 -
 7
7 -
 8
8 -
 9
9 -
 10
10 -
 11
11 -
 12
12 -
 13
13 -
 14
14 -
 15
15 -
16
-
17
-
18
-
19
-
20
-
21
-
22
-
23
-
24
-
25
-
26
-
27
-
28
-
29
-
30
-
31
-
32
-
33
-
34
-
35
-
36
-
37
-
38
-
39
-
40
-
41
-
42
-
43
-
44
-
45
-
46
-
47
-
48
-
49
-
50
-
51
-
52
-
53
-
54
-
55
-
56
-
57
-
58
-
59
-
60
-
61
-
62
-
63
-
64
-
65
-
66
-
67
-
68
-
69
-
70
-
71
-
72
-
73
-
74
-
75
-
76
-
77
-
78
-
79
-
80
-
81
-
82
-
83
-
84
-
85
-
86
-
87
-
88
-
89
-
90
-
91
-
92
-
93
-
94
-
95
-
96
-
97
-
98
-
99
-
100
-
101
-
102
-
103
-
104
-
105
-
106
-
107
-
108
-
109
-
110
-
111
-
112
-
113
-
114
-
115
-
116
-
117
-
118
-
119
-
120
-
121
-
122
-
123
-
124
-
125
-
126
-
127
 |
 |

02
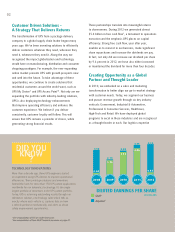
Customer Driven Solutions –
A Strategy That Delivers Returns
The transformation of UPS from a package delivery
company to a global supply chain leader began many
years ago. We’ve been inventing solutions to efficiently
deliver customers whatever they need, wherever they
need it, whenever they need it. Along the way we
recognized the impact globalization and technology
would have on manufacturing, distribution and consumer
shopping paradigms. For example, the ever-expanding
online market presents UPS with growth prospects now
and well into the future. To take advantage of these
opportunities, we continue to create solutions that
residential customers around the world want, such as
UPS My Choice® and UPS Access Point™. Not only are we
expanding the portfolio with industry-leading solutions,
UPS is also deploying technology enhancements
that improve operating efficiency and enhance the
customer experience. We believe if you deliver
consistently, customer loyalty will follow. This will
ensure that UPS remains a provider of choice, while
generating strong financial results.
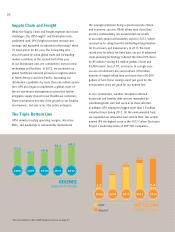
These partnerships translate into meaningful returns
to shareowners. During 2012 we generated almost
$5.4 billion in free cash flow2, a testament to operations
execution and the emphasis UPS places on capital
efficiency. Strong free cash flow, year after year,
enables us to reinvest in our business, make significant
share repurchases and increase the dividends we pay.
In fact, not only did we increase our dividend per share
by 9.6 percent in 2012, we have also either increased
or maintained the dividend for more than four decades.
Creating Opportunity as a Global
Partner and Thought Leader
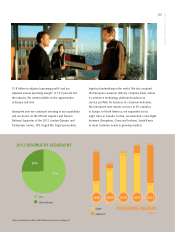
In 2010, we embarked on a sales and marketing
transformation to better align our go-to-market strategy
with customer needs. Today, we segment our business
and pursue revenue growth through six key industry
verticals: Government, Industrial & Automotive,
Professional & Consumer Services, Healthcare,
High-Tech and Retail. We have deployed global
programs to excel in these industries and are recognized
as a thought leader in each. Our logistics expertise
TECHNOLOGY INNOVATIONS
More than a decade ago, three UPS engineers started
an experiment using GPS devices to improve operational
efficiencies. Their prototype solutions and inventions
formed the basis for more than 150 UPS patent applications
worldwide for our telematics technology. It’s the single
largest portfolio of inventions in the UPS patent portfolio.
Today, UPS is achieving outstanding results through our
telematics solution, a technology suite which tells us
exactly where each vehicle is, captures data on how
a vehicle performs mechanically, and alerts us about
safety improvement opportunities.
2 See reconciliation of FCF on inside front cover.
3 See reconciliation of Non-GAAP financial measures on page A1.
DID YOU
KNOW
DID
YOU
DID YOU
?
NO
NO
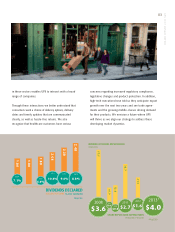
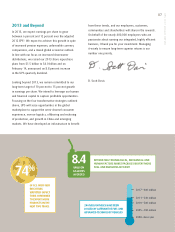
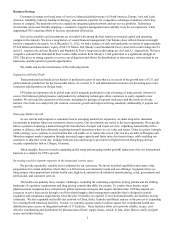
3.58
IN DOLLARS
DILUTED EARNINGS PER SHARE
2008 2009 2010 2011 2012
0.64
2.13
1.96
3.48
3.33
4.35
3.84
4.53
0.83
GAAP
Adjusted3