UPS 2012 Annual Report Download - page 126
Download and view the complete annual report
Please find page 126 of the 2012 UPS annual report below. You can navigate through the pages in the report by either clicking on the pages listed below, or by using the keyword search tool below to find specific information within the annual report.-
 1
1 -
2
-
3
-
4
-
5
-
6
-
7
-
8
-
9
-
10
-
11
-
12
-
13
-
14
-
15
-
16
-
17
-
18
-
19
-
20
-
21
-
22
-
23
-
24
-
25
-
26
-
27
-
28
-
29
-
30
-
31
-
32
-
33
-
34
-
35
-
36
-
37
-
38
-
39
-
40
-
41
-
42
-
43
-
44
-
45
-
46
-
47
-
48
-
49
-
50
-
51
-
52
-
53
-
54
-
55
-
56
-
57
-
58
-
59
-
60
-
61
-
62
-
63
-
64
-
65
-
66
-
67
-
68
-
69
-
70
-
71
-
72
-
73
-
74
-
75
-
76
-
77
-
78
-
79
-
80
-
81
-
82
-
83
-
84
-
85
-
86
-
87
-
88
-
89
-
90
-
91
-
92
-
93
-
94
-
95
-
96
-
97
-
98
-
99
-
100
-
101
-
102
-
103
-
104
-
105
-
106
-
107
-
108
-
109
-
110
-
111
-
112
-
113
-
114
-
115
-
 116
116 -
 117
117 -
 118
118 -
 119
119 -
 120
120 -
 121
121 -
 122
122 -
 123
123 -
 124
124 -
 125
125 -
 126
126 -
 127
127
 |
 |

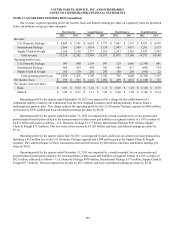
Reconciliation of Non-GAAP Financial Measures
(amounts in millions, except per share amounts)
2012 2011 2010 2009 2008 2012 2011 2010 2009 2008
Reported / GAAP 807$ 3,804$ 3,338$ 1,968$ 655$0.83$3.84$3.33$1.96$0.64$
Defined Benefit Plans Mark-to-Market Charge 3,023 527 75 11 2,428 3.12 0.53 0.07 0.01 2.38
RestructuringCharge -- 64----0.06--
Gains on Real Estate Transactions - (20) (61) - - - (0.02) (0.06) - -
MultiemployerPensionPlanWithdrawalCharge 559----0.58----
Gains/LossesonSalesofBusinesses -- 3----0.00--
ChargeforChangeinTaxFilingStatusforGermanSubsidiary -- 76----0.08--
Goodwill and Intangible Asset Impairments ----575----0.56
AircraftImpairment ---116----0.11-
RemeasurementofCertainForeign-CurrencyDenominatedObligations --- 48----0.05-
Adjusted 4,389$ 4,311$ 3,495$ 2,143$ 3,658$4.53$4.35$3.48$2.13$3.58$
2012 2011 2010 2009 2008 2012 2011 2010 2009 2008
Reported / GAAP 1,343$ 6,080$ 5,641$ 3,508$ 1,619$ 2.5% 11.4% 11.4% 7.7% 3.1%
Defined Benefit Plans Mark-to-Market Charge 4,831 827 112 16 3,892 8.9% 1.6% 0.2% 0.1% 7.6%
Restructuring Charge - - 98 - - 0.0% 0.0% 0.2% 0.0% 0.0%
Gains on Real Estate Transactions - (33) (109) - - 0.0% -0.1% -0.2% 0.0% 0.0%
MultiemployerPensionPlanWithdrawalCharge 896----1.7%0.0%0.0%0.0%0.0%
Gains / Losses on Sales of Businesses - - (20) - - 0.0% 0.0% -0.1% 0.0% 0.0%
Goodwill and Intangible Asset Impairments ----5750.0%0.0%0.0%0.0%1.1%
Aircraft Impairment - - - 181 - 0.0% 0.0% 0.0% 0.4% 0.0%
Adjusted 7,070$ 6,874$ 5,722$ 3,705$ 6,086$ 13.1% 12.9% 11.5% 8.2% 11.8%
2012 2011 2010 2012 2011 2010
Beginning Balance (Reported / GAAP) 34,701$ 33,597$ 31,883$ 7,108$ 8,047$ 7,696$
Ending Balance (Reported / GAAP) 38,863$ 34,701$ 33,597$ 4,733$ 7,108$ 8,047$
Defined Benefit Plans Mark-to-Market Charge - - - 3,023 527 75
Restructuring Charge - - 98 - - 64
Gains on Real Estate Transactions - (33) (109) - (20) (61)
Multiemployer Pension Plan Withdrawal Charge - - - 559 - -
Gains / Losses on Sales of Businesses - - (20) - - 3
Charge for Change in Tax Filing Status for German Subsidiary - - - - - 76
Long-Term U.S. Deferred Tax Assets (Related to the Mark-to-Market Charge) (559) - - - - -
Adjusted Ending Balance 38,304$ 34,668$ 33,566$ 8,315$ 7,615$ 8,204$
Average Reported Balance ((Reported Beginning + Reported Ending) / 2) 36,782$ 34,149$ 32,740$ 5,921$ 7,578$ 7,872$
Average Adjusted Balance ((Reported Beginning + Adjusted Ending) / 2) 36,503$ 34,133$ 32,725$ 7,712$ 7,831$ 7,950$
Return on Reported Balance (Reported Net Income / Average Reported Balance) 2.2% 11.1% 10.2% 13.6% 50.2% 42.4%
Return on Adjusted Balance (Adjusted Net Income / Average Adjusted Balance) 12.0% 12.6% 10.7% 56.9% 55.1% 44.0%
Return on Invested Capital
Reported Adjusted Reported Adjusted Reported Adjusted
Operating Profit 1,343$ 7,070$ 6,080$ 6,874$ 5,641$ 5,722$
Less: Taxes (230) (2,439) (2,073) (2,365) (2,082) (1,997)
1,113$ 4,631$ 4,007$ 4,509$ 3,559$ 3,725$
Beginning LT Debt 11,095$ 11,095$ 10,491
$ 10,491$ 8,668$ 8,668$
Ending LT Debt 11,089 11,089 11,095 11,095 10,491 10,491
Beginning Shareowners' Equit
y
7,108 7,108 8,047 8,047 7,696 7,696
Ending Shareowners' Equit
y
4,733 8,315 7,108 7,615 8,047 8,204
Average Invested Capital 17,013$ 18,804$ 18,371$ 18,624$ 17,451$ 17,530$
Return on Invested Capital 6.5% 24.6% 21.8% 24.2% 20.4% 21.2%
UPS Freight Operating Margin 2012 2011
Reported / GAAP -7.9% -2.2%
Defined Benefit Plans Mark-to-Market Charge 11.6% 5.2%
Adjusted 3.7% 3.0%
Note: The adjustments denoted in the tables above are further described in our annual reports on Form 10-K for the years ended December 31, 2012, 2011 and 2010, as well as in the historical financial
schedules on our investor relations website. The taxes deducted from operating profit in the return on invested capital calculation are based on the reported and adjusted effective tax rates noted
on page 38 of our 2012 annual report on Form 10-K. The adjusted operating profit and operating margin for our U.S. Domestic Package segment is noted on page 24 of our 2012 annual report on
Form 10-K, while the International Package segment adjusted operating profit and margin are reflected on page 28 of the 2012 10-K.
Note: We supplement the reporting of our financial information determined under Generally Accepted Accounting Principles ("GAAP") with certain non-GAAP financial measures, including net income,
earnings per share, operating profit, operating margin, return on assets, return on equity, and return on invested capital adjusted for the non-comparable items listed in the tables above. We
believe these adjusted measures provide meaningful information to assist investors and analysts in understanding our financial results and assessing our prospects for future performance. We
believe these adjusted financial measures are important indicators of our recurring results of operations because they exclude items that may not be indicative of, or are unrelated to, our core
operating results, and provide a better baseline for analyzing trends in our underlying businesses.
Diluted Earnings Per Share
Operating Profit Operating Margin
2012 2011 2010
Return on Assets Return on Shareowners' Equity
A1