UPS 2012 Annual Report Download - page 78
Download and view the complete annual report
Please find page 78 of the 2012 UPS annual report below. You can navigate through the pages in the report by either clicking on the pages listed below, or by using the keyword search tool below to find specific information within the annual report.-
 1
1 -
2
-
3
-
4
-
5
-
6
-
7
-
8
-
9
-
10
-
11
-
12
-
13
-
14
-
15
-
16
-
17
-
18
-
19
-
20
-
21
-
22
-
23
-
24
-
25
-
26
-
27
-
28
-
29
-
30
-
31
-
32
-
33
-
34
-
35
-
36
-
37
-
38
-
39
-
40
-
41
-
42
-
43
-
44
-
45
-
46
-
47
-
48
-
49
-
50
-
51
-
52
-
53
-
54
-
55
-
56
-
57
-
58
-
59
-
60
-
61
-
62
-
63
-
64
-
65
-
66
-
67
-
 68
68 -
 69
69 -
 70
70 -
 71
71 -
 72
72 -
 73
73 -
 74
74 -
 75
75 -
 76
76 -
 77
77 -
 78
78 -
 79
79 -
 80
80 -
 81
81 -
 82
82 -
 83
83 -
 84
84 -
 85
85 -
 86
86 -
 87
87 -
 88
88 -
89
-
90
-
91
-
92
-
93
-
94
-
95
-
96
-
97
-
98
-
99
-
100
-
101
-
102
-
103
-
104
-
105
-
106
-
107
-
108
-
109
-
110
-
111
-
112
-
113
-
114
-
115
-
116
-
117
-
118
-
119
-
120
-
121
-
122
-
123
-
124
-
125
-
126
-
127
 |
 |

UNITED PARCEL SERVICE, INC. AND SUBSIDIARIES
NOTES TO CONSOLIDATED FINANCIAL STATEMENTS
66
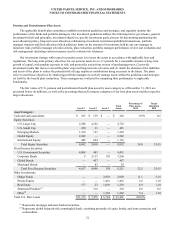
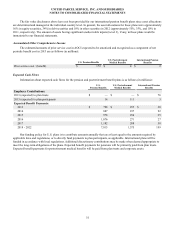
We maintain holdings in certain investment partnerships that are measured at fair value utilizing Level 3 inputs (classified
as “other investments” in the tables below, and as “Other Non-Current Assets” in the consolidated balance sheets). These
partnership holdings do not have quoted prices, nor can they be valued using inputs based on observable market data. These
investments are valued internally using a discounted cash flow model with two significant inputs: (1) the after-tax cash flow
projections for each partnership, and (2) a risk-adjusted discount rate consistent with the duration of the expected cash flows for
each partnership. The weighted-average discount rates used to value these investments were 7.75% and 7.91% as of
December 31, 2012 and 2011, respectively. These inputs and the resulting fair values are updated on a quarterly basis.
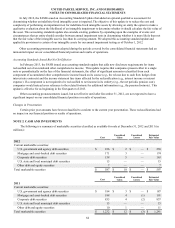
The following table presents information about our investments measured at fair value on a recurring basis as of
December 31, 2012 and 2011, and indicates the fair value hierarchy of the valuation techniques utilized to determine such fair
value (in millions).
Quoted
Prices in
Active
Markets for
Identical
Assets
(Level 1)
Significant
Other
Observable
Inputs
(Level 2)
Significant
Unobservable
Inputs
(Level 3) Total
2012
Marketable securities:
U.S. government and agency debt securities $ 237 $ 1 $ — $ 238
Mortgage and asset-backed debt securities — 174 — 174
Corporate debt securities — 163 — 163
U.S. state and local municipal debt securities — 15 — 15
Other debt and equity securities — 7 — 7
Total marketable securities 237 360 — 597
Other investments 19 — 163 182
Total $ 256 $ 360 $ 163 $ 779
Quoted
Prices in
Active
Markets for
Identical
Assets
(Level 1)
Significant
Other
Observable
Inputs
(Level 2)
Significant
Unobservable
Inputs
(Level 3) Total
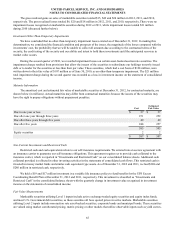
2011
Marketable securities:
U.S. government and agency debt securities $ 187 $ — $ — $ 187
Mortgage and asset-backed debt securities — 191 — 191
Corporate debt securities — 837 — 837
U.S. state and local municipal debt securities — 15 — 15
Other debt and equity securities — 11 — 11
Total marketable securities 187 1,054 — 1,241
Other investments 17 — 217 234
Total $ 204 $ 1,054 $ 217 $ 1,475