UPS 2012 Annual Report Download - page 53
Download and view the complete annual report
Please find page 53 of the 2012 UPS annual report below. You can navigate through the pages in the report by either clicking on the pages listed below, or by using the keyword search tool below to find specific information within the annual report.-
 1
1 -
2
-
3
-
4
-
5
-
6
-
7
-
8
-
9
-
10
-
11
-
12
-
13
-
14
-
15
-
16
-
17
-
18
-
19
-
20
-
21
-
22
-
23
-
24
-
25
-
26
-
27
-
28
-
29
-
30
-
31
-
32
-
33
-
34
-
35
-
36
-
37
-
38
-
39
-
40
-
41
-
42
-
 43
43 -
 44
44 -
 45
45 -
 46
46 -
 47
47 -
 48
48 -
 49
49 -
 50
50 -
 51
51 -
 52
52 -
 53
53 -
 54
54 -
 55
55 -
 56
56 -
 57
57 -
 58
58 -
 59
59 -
 60
60 -
 61
61 -
 62
62 -
 63
63 -
64
-
65
-
66
-
67
-
68
-
69
-
70
-
71
-
72
-
73
-
74
-
75
-
76
-
77
-
78
-
79
-
80
-
81
-
82
-
83
-
84
-
85
-
86
-
87
-
88
-
89
-
90
-
91
-
92
-
93
-
94
-
95
-
96
-
97
-
98
-
99
-
100
-
101
-
102
-
103
-
104
-
105
-
106
-
107
-
108
-
109
-
110
-
111
-
112
-
113
-
114
-
115
-
116
-
117
-
118
-
119
-
120
-
121
-
122
-
123
-
124
-
125
-
126
-
127
 |
 |
UNITED PARCEL SERVICE, INC. AND SUBSIDIARIES
MANAGEMENT'S DISCUSSION AND ANALYSIS OF FINANCIAL CONDITION AND
RESULTS OF OPERATIONS
41
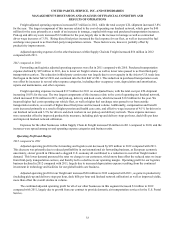
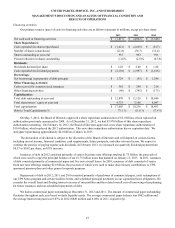
Financing Activities
Our primary sources (uses) of cash for financing activities are as follows (amounts in millions, except per share data):
2012 2011 2010
Net cash used in financing activities $ (1,817) $ (4,862) $ (1,346)
Share Repurchases:
Cash expended for shares repurchased $ (1,621) $ (2,665) $ (817)
Number of shares repurchased (21.8) (38.7) (12.4)
Shares outstanding at year-end 953 963 991
Percent reduction in shares outstanding (1.0)% (2.8)% (0.3)%
Dividends:
Dividends declared per share $ 2.28 $ 2.08 $ 1.88
Cash expended for dividend payments $ (2,130) $ (1,997) $ (1,818)
Borrowings:
Net borrowings (repayments) of debt principal $ 1,729 $ (95) $ 1,246
Other Financing Activities:
Cash received for common stock issuances $ 301 $ 290 $ 218
Other financing activities $ (96) $ (395) $ (175)
Capitalization:
Total debt outstanding at year-end $ 12,870 $ 11,128 $ 10,846
Total shareowners’ equity at year-end 4,733 7,108 8,047
Total capitalization $ 17,603 $ 18,236 $ 18,893
Debt to Total Capitalization % 73.1 % 61.0 % 57.4 %
On May 3, 2012, the Board of Directors approved a share repurchase authorization of $5.0 billion, which replaced an
authorization previously announced in 2008. As of December 31, 2012, we had $3.970 billion of this share repurchase
authorization remaining. On February 14, 2013, the Board of Directors approved a new share repurchase authorization of
$10.0 billion, which replaced the 2012 authorization. This new share repurchase authorization has no expiration date. We
anticipate repurchasing approximately $4.0 billion of shares in 2013.
The declaration of dividends is subject to the discretion of the Board of Directors and will depend on various factors,
including our net income, financial condition, cash requirements, future prospects, and other relevant factors. We expect to
continue the practice of paying regular cash dividends. In February 2013, we increased our quarterly dividend payment from
$0.57 to $0.62 per share, an 8.8% increase.
Issuances of debt in 2012 consisted primarily of senior fixed rate note offerings totaling $1.75 billion, the proceeds of
which were used to repay the principal balance of our $1.75 billion notes that matured on January 15, 2013. In 2011, issuances
of debt consisted primarily of commercial paper and five new aircraft leases. In 2010, issuances of debt consisted of senior
fixed rate note offerings totaling $2.0 billion, the proceeds of which were used to make discretionary contributions to UPS-
sponsored pension plans and other general corporate purposes.
Repayments of debt in 2012, 2011 and 2010 consisted primarily of paydowns of commercial paper, early redemptions of
our UPS Notes program and certain facilities bonds, and scheduled principal payments on our capitalized lease obligations. We
consider the overall fixed and floating interest rate mix of our portfolio and the related overall cost of borrowing when planning
for future issuances and non-scheduled repayments of debt.
We had no commercial paper outstanding at December 31, 2012 and 2011. The amount of commercial paper outstanding
fluctuates throughout each year based on daily liquidity needs. The average commercial paper balance was $962 million and
the average interest rate paid was 0.07% in 2012 ($849 million and 0.08% in 2011, respectively).