UPS 2012 Annual Report Download - page 45
Download and view the complete annual report
Please find page 45 of the 2012 UPS annual report below. You can navigate through the pages in the report by either clicking on the pages listed below, or by using the keyword search tool below to find specific information within the annual report.-
 1
1 -
2
-
3
-
4
-
5
-
6
-
7
-
8
-
9
-
10
-
11
-
12
-
13
-
14
-
15
-
16
-
17
-
18
-
19
-
20
-
21
-
22
-
23
-
24
-
25
-
26
-
27
-
28
-
29
-
30
-
31
-
32
-
33
-
34
-
 35
35 -
 36
36 -
 37
37 -
 38
38 -
 39
39 -
 40
40 -
 41
41 -
 42
42 -
 43
43 -
 44
44 -
 45
45 -
 46
46 -
 47
47 -
 48
48 -
 49
49 -
 50
50 -
 51
51 -
 52
52 -
 53
53 -
 54
54 -
 55
55 -
56
-
57
-
58
-
59
-
60
-
61
-
62
-
63
-
64
-
65
-
66
-
67
-
68
-
69
-
70
-
71
-
72
-
73
-
74
-
75
-
76
-
77
-
78
-
79
-
80
-
81
-
82
-
83
-
84
-
85
-
86
-
87
-
88
-
89
-
90
-
91
-
92
-
93
-
94
-
95
-
96
-
97
-
98
-
99
-
100
-
101
-
102
-
103
-
104
-
105
-
106
-
107
-
108
-
109
-
110
-
111
-
112
-
113
-
114
-
115
-
116
-
117
-
118
-
119
-
120
-
121
-
122
-
123
-
124
-
125
-
126
-
127
 |
 |
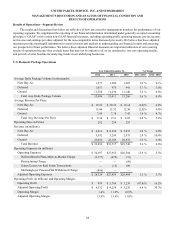
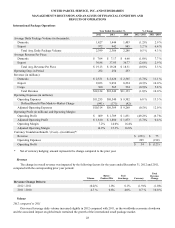
UNITED PARCEL SERVICE, INC. AND SUBSIDIARIES
MANAGEMENT'S DISCUSSION AND ANALYSIS OF FINANCIAL CONDITION AND
RESULTS OF OPERATIONS
33
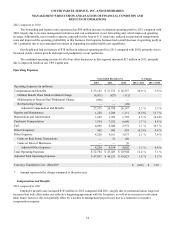
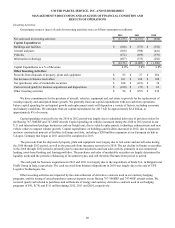
Freight adjusted operating expenses increased $57 million in 2012, while the total cost per LTL shipment increased 3.8%
for the year. The largest component of this increase related to the cost of operating our linehaul network, which grew by $40
million for the year, primarily as a result of an increase in tonnage, coupled with wage and purchased transportation increases.
Pick-up and delivery costs increased $12 million for the year, largely due to the increase in tonnage as well as contractual
driver wage increases of 3.5%. Rising diesel fuel prices increased the fuel expense for our fleet, as well as increased the fuel
surcharge rates passed to us from third-party transportation carriers. These factors were, however, partially offset by
productivity improvements.
Adjusted operating expenses for the other businesses within Supply Chain & Freight increased $56 million in 2012
compared with 2011.
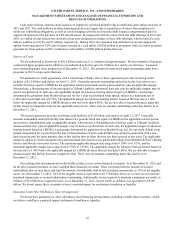
2011 compared to 2010
Forwarding and logistics adjusted operating expenses were flat in 2011 compared with 2010. Purchased transportation
expense declined by $87 million in 2011, due to lower air freight volume as well as lower rates passed to us from third-party
transportation carriers. The reduction in third-party carrier rates was largely due to over-capacity in the Asia-to-U.S. trade lane
that began in the latter half of 2010 and continued into the first half of 2011. This reduction in purchased transportation costs
was offset by increases in several other expense categories, including other occupancy costs, depreciation and amortization,
repairs and maintenance, and other expenses.
Freight operating expenses increased $317 million for 2011 on an adjusted basis, with the total cost per LTL shipment
increasing 10.0% for the year. The two largest components of this increase relate to the cost of operating our linehaul network,
which increased $134 million in 2011, and pick-up, delivery and dock costs, which increased $112 million for the year. We
incurred higher fuel costs operating our vehicle fleet, as well as higher fuel surcharge rates passed to us from outside
transportation carriers, as a result of higher diesel fuel prices and increased volume. Additionally, compensation and benefit
costs increased primarily as a result of higher pension and health care costs, and effective wage increases of 4.1% for drivers in
our linehaul network and 3.5% for drivers and dock workers in our pick-up and delivery network. These expense increases
were somewhat offset by improved productivity measures, including pick-up and delivery stops per hour, dock bills per hour
and improved linehaul network utilization.
Expenses for the other businesses within Supply Chain & Freight increased $6 million in 2011 compared to 2010, and the
increases were spread among several operating expense categories and business units.
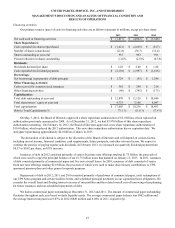
Operating Profit and Margin
2012 compared to 2011
Adjusted operating profit for the forwarding and logistics unit decreased by $29 million in 2012 compared with 2011.
This decrease was primarily due to reduced profitability in our international air forwarding business, as European economic
uncertainty, slower growth in China and a sluggish U.S. economy all contributed to a reduction in overall air freight market
demand. This lower demand pressured the rates we charge to our customers, which more than offset the reduced rates we incur
from third-party transportation carriers, and thereby led to a decline in our operating margin. Operating profit for our logistics
business declined in 2012 compared with 2011, largely due to increased depreciation expense resulting from the continued
investment in technology and facilities for our global health care business.
Adjusted operating profit for our freight unit increased $20 million in 2012 compared with 2011, as gains in productivity
(including pick-up and delivery stops per hour, dock bills per hour and linehaul network utilization) as well as improved yields,
more than offset the overall decline in volume.
The combined adjusted operating profit for all of our other businesses in this segment increased $1 million in 2012
compared with 2011, largely due to growth from our contract to provide domestic air transportation services for the U.S. Postal
Service.