UPS 2012 Annual Report Download - page 43
Download and view the complete annual report
Please find page 43 of the 2012 UPS annual report below. You can navigate through the pages in the report by either clicking on the pages listed below, or by using the keyword search tool below to find specific information within the annual report.-
 1
1 -
2
-
3
-
4
-
5
-
6
-
7
-
8
-
9
-
10
-
11
-
12
-
13
-
14
-
15
-
16
-
17
-
18
-
19
-
20
-
21
-
22
-
23
-
24
-
25
-
26
-
27
-
28
-
29
-
30
-
31
-
32
-
 33
33 -
 34
34 -
 35
35 -
 36
36 -
 37
37 -
 38
38 -
 39
39 -
 40
40 -
 41
41 -
 42
42 -
 43
43 -
 44
44 -
 45
45 -
 46
46 -
 47
47 -
 48
48 -
 49
49 -
 50
50 -
 51
51 -
 52
52 -
 53
53 -
54
-
55
-
56
-
57
-
58
-
59
-
60
-
61
-
62
-
63
-
64
-
65
-
66
-
67
-
68
-
69
-
70
-
71
-
72
-
73
-
74
-
75
-
76
-
77
-
78
-
79
-
80
-
81
-
82
-
83
-
84
-
85
-
86
-
87
-
88
-
89
-
90
-
91
-
92
-
93
-
94
-
95
-
96
-
97
-
98
-
99
-
100
-
101
-
102
-
103
-
104
-
105
-
106
-
107
-
108
-
109
-
110
-
111
-
112
-
113
-
114
-
115
-
116
-
117
-
118
-
119
-
120
-
121
-
122
-
123
-
124
-
125
-
126
-
127
 |
 |

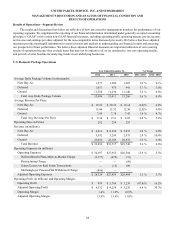
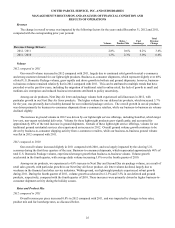
UNITED PARCEL SERVICE, INC. AND SUBSIDIARIES
MANAGEMENT'S DISCUSSION AND ANALYSIS OF FINANCIAL CONDITION AND
RESULTS OF OPERATIONS
31
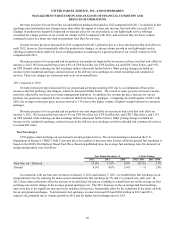
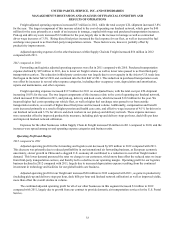
2011 compared to 2010
Adjusted operating profit increased slightly in 2011 compared with 2010, while the segment operating margin declined
for the year due to several factors. The overall increase in adjusted operating profit was largely due to the volume and revenue
per piece increases previously discussed; however, the impact of these items was largely offset by excess capacity and the
adverse impact of fuel prices and currency exchange rate movements. Volume softness in the Asia-to-U.S. trade lane in the
latter half of 2011 resulted in excess transportation capacity, which negatively affected margins while our transportation
network was being adjusted for the slowing demand. Fluctuations in foreign currency exchange rates (net of our hedging
programs) resulted in an adverse impact on operating profit comparisons between 2011 and 2010 of $123 million. Additionally,
fuel prices negatively affected the operating profit comparison between 2011 and 2010, as fuel expense increased at a faster
pace than fuel surcharge revenue. These factors resulted in a decrease in the operating margin in 2011 compared with 2010.
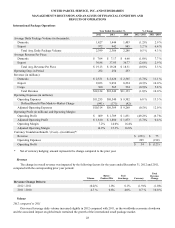
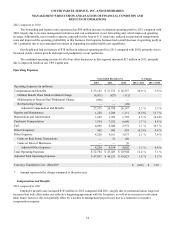
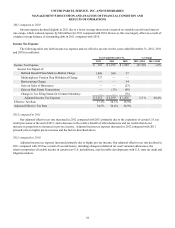
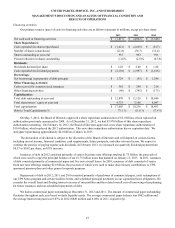
Supply Chain & Freight Operations
Year Ended December 31, % Change
2012 2011 2010 2012 / 2011 2011 / 2010
Freight LTL Statistics:
Revenue (in millions) $ 2,377 $ 2,299 $ 2,002 3.4 % 14.8%
Revenue Per Hundredweight $ 21.73 $ 21.17 $ 19.18 2.6 % 10.4%
Shipments (in thousands) 10,136 10,247 9,952 (1.1)% 3.0%
Shipments Per Day (in thousands) 40.1 40.5 39.5 (1.1)% 2.5%
Gross Weight Hauled (in millions of lbs) 10,939 10,858 10,440 0.7 % 4.0%
Weight Per Shipment (in lbs) 1,079 1,060 1,049 1.8 % 1.0%
Operating Days in Period 253 253 252
Revenue (in millions):
Forwarding and Logistics $ 5,977 $ 6,103 $ 6,022 (2.1)% 1.3%
Freight 2,640 2,563 2,208 3.0 % 16.1%
Other 530 473 440 12.1 % 7.5%
Total Revenue $ 9,147 $ 9,139 $ 8,670 0.1 % 5.4%
Operating Expenses (in millions):
Operating Expenses $ 9,132 $ 8,532 $ 8,098 7.0 % 5.4%
Defined Benefit Plans Mark-to-Market Charge (713)(177)(39)
Gains on Real Estate Transactions — 48 —
Gains on Sales of Businesses — — 20
Adjusted Operating Expenses $ 8,419 $ 8,403 $ 8,079 0.2 % 4.0%
Operating Profit (in millions) and Operating Margins:
Operating Profit $ 15 $ 607 $ 572 (97.5)% 6.1%
Adjusted Operating Profit $ 728 $ 736 $ 591 (1.1)% 24.5%
Operating Margin 0.2% 6.6% 6.6%
Adjusted Operating Margin 8.0% 8.1% 6.8%
Currency Translation Benefit / (Cost)—(in millions)*:
Revenue $ (100) $ 139
Operating Expenses 97 (132)
Operating Profit $ (3) $ 7
* Amount represents the change compared to the prior year.