UPS 2012 Annual Report Download - page 34
Download and view the complete annual report
Please find page 34 of the 2012 UPS annual report below. You can navigate through the pages in the report by either clicking on the pages listed below, or by using the keyword search tool below to find specific information within the annual report.-
 1
1 -
2
-
3
-
4
-
5
-
6
-
7
-
8
-
9
-
10
-
11
-
12
-
13
-
14
-
15
-
16
-
17
-
18
-
19
-
20
-
21
-
22
-
23
-
 24
24 -
 25
25 -
 26
26 -
 27
27 -
 28
28 -
 29
29 -
 30
30 -
 31
31 -
 32
32 -
 33
33 -
 34
34 -
 35
35 -
 36
36 -
 37
37 -
 38
38 -
 39
39 -
 40
40 -
 41
41 -
 42
42 -
 43
43 -
 44
44 -
45
-
46
-
47
-
48
-
49
-
50
-
51
-
52
-
53
-
54
-
55
-
56
-
57
-
58
-
59
-
60
-
61
-
62
-
63
-
64
-
65
-
66
-
67
-
68
-
69
-
70
-
71
-
72
-
73
-
74
-
75
-
76
-
77
-
78
-
79
-
80
-
81
-
82
-
83
-
84
-
85
-
86
-
87
-
88
-
89
-
90
-
91
-
92
-
93
-
94
-
95
-
96
-
97
-
98
-
99
-
100
-
101
-
102
-
103
-
104
-
105
-
106
-
107
-
108
-
109
-
110
-
111
-
112
-
113
-
114
-
115
-
116
-
117
-
118
-
119
-
120
-
121
-
122
-
123
-
124
-
125
-
126
-
127
 |
 |

22
Item 7. Management’s Discussion and Analysis of Financial Condition and Results of Operation
Overview
The U.S. economic expansion has continued at a slow-to-moderate pace through the end of 2012. Continued growth in
retail sales, particularly among e-commerce retailers, has provided for expansion in the overall U.S. small package delivery
market; however, recent weakness in manufacturing activity, combined with the uneven nature of the overall economic
recovery, has negatively impacted the small package delivery market. Given these trends, our products most aligned with
business-to-consumer shipments have experienced the strongest growth, while our business-to-business volume continues to
lag overall GDP growth.
Outside of the U.S., economic growth has slowed considerably due to volatility in world markets and fiscal austerity
measures, particularly in Europe. This slower global economic growth has created an environment in which customers are
more likely to trade-down from premium express products to standard delivery products. Additionally, the uneven nature of
economic growth worldwide has led to shifting trade patterns whereby transcontinental trade is being pressured, but intra-
regional trade is continuing to grow. These circumstances have led us to adjust our air capacity and cost structure in our
transportation network to the prevailing volume mix levels. Our broad portfolio of product offerings and the flexibilities
inherent in our transportation network have helped us adapt to these changing trends.
While the worldwide economic environment has been challenging in 2012, we have continued to undertake initiatives to
improve yield management, increase operational efficiency and contain costs across all segments. Continued deployment of
technology improvements should lead to further gains in our operational efficiency, flexibility and reliability, thus restraining
cost increases and improving margins. In our International Package segment, we have adjusted our air network and utilized
newly constructed or expanded operating facilities to improve time-in-transit for shipments in each region. We have also
continued to optimize our aircraft network to leverage the new route authority we have gained over the last several years and to
take full advantage of faster growing trade lanes. Additionally, in the first quarter of 2012, we acquired Kiala S.A., which will
expand our service offerings for business-to-consumer deliveries in Europe.
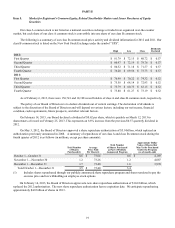
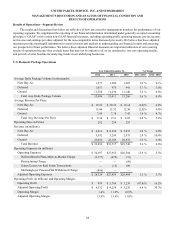
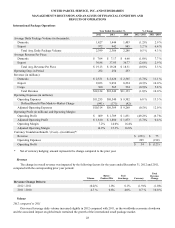
Our consolidated results are presented in the table below:
Year Ended December 31, % Change
2012 2011 2010 2012 / 2011 2011 / 2010
Revenue (in millions) $ 54,127 $ 53,105 $ 49,545 1.9 % 7.2%
Operating Expenses (in millions) 52,784 47,025 43,904 12.2 % 7.1%
Operating Profit (in millions) $ 1,343 $ 6,080 $ 5,641 (77.9)% 7.8%
Operating Margin 2.5% 11.4% 11.4%
Average Daily Package Volume (in thousands) 16,295 15,797 15,574 3.2 % 1.4%
Average Revenue Per Piece $ 10.82 $ 10.82 $ 10.24 — % 5.7%
Net Income (in millions) $ 807 $ 3,804 $ 3,338 (78.8)% 14.0%
Basic Earnings Per Share $ 0.84 $ 3.88 $ 3.36 (78.4)% 15.5%
Diluted Earnings Per Share $ 0.83 $ 3.84 $ 3.33 (78.4)% 15.3%
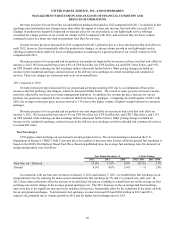
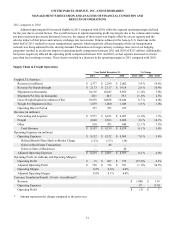
Items Affecting Comparability
The year-over-year comparisons of our financial results are affected by the following items (in millions):
Year Ended December 31,
2012 2011 2010
Operating Expenses:
Defined Benefit Plans Mark-to-Market Charge $ 4,831 $ 827 $ 112
Multiemployer Pension Plan Withdrawal Charge 896 — —
Restructuring Charge — — 98
Gains on Sales of Businesses — — (20)
Gains on Real Estate Transactions — (33)(109)
Income Tax Expense (Benefit) from the Items Above (2,145)(287) —
Charge for Change in Tax Filing Status for German Subsidiary — — 76