UPS 2012 Annual Report Download - page 39
Download and view the complete annual report
Please find page 39 of the 2012 UPS annual report below. You can navigate through the pages in the report by either clicking on the pages listed below, or by using the keyword search tool below to find specific information within the annual report.-
 1
1 -
2
-
3
-
4
-
5
-
6
-
7
-
8
-
9
-
10
-
11
-
12
-
13
-
14
-
15
-
16
-
17
-
18
-
19
-
20
-
21
-
22
-
23
-
24
-
25
-
26
-
27
-
28
-
 29
29 -
 30
30 -
 31
31 -
 32
32 -
 33
33 -
 34
34 -
 35
35 -
 36
36 -
 37
37 -
 38
38 -
 39
39 -
 40
40 -
 41
41 -
 42
42 -
 43
43 -
 44
44 -
 45
45 -
 46
46 -
 47
47 -
 48
48 -
 49
49 -
50
-
51
-
52
-
53
-
54
-
55
-
56
-
57
-
58
-
59
-
60
-
61
-
62
-
63
-
64
-
65
-
66
-
67
-
68
-
69
-
70
-
71
-
72
-
73
-
74
-
75
-
76
-
77
-
78
-
79
-
80
-
81
-
82
-
83
-
84
-
85
-
86
-
87
-
88
-
89
-
90
-
91
-
92
-
93
-
94
-
95
-
96
-
97
-
98
-
99
-
100
-
101
-
102
-
103
-
104
-
105
-
106
-
107
-
108
-
109
-
110
-
111
-
112
-
113
-
114
-
115
-
116
-
117
-
118
-
119
-
120
-
121
-
122
-
123
-
124
-
125
-
126
-
127
 |
 |
UNITED PARCEL SERVICE, INC. AND SUBSIDIARIES
MANAGEMENT'S DISCUSSION AND ANALYSIS OF FINANCIAL CONDITION AND
RESULTS OF OPERATIONS
27
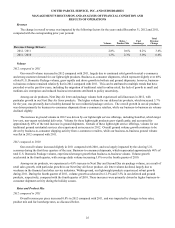
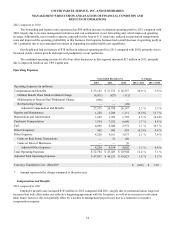
Operating Expenses
2012 compared to 2011
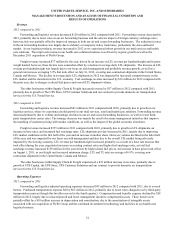
Overall adjusted operating expenses for the segment increased $865 million in 2012 compared with 2011. This increase
was primarily due to pick-up and delivery costs, which grew $682 million, as well as the cost of operating our domestic
integrated air and ground network, which increased $238 million for the year. The growth in pick-up and delivery and network
costs was largely due to increased volume and higher employee compensation costs, which were impacted by a union
contractual wage increase (package driver wage rates rose 2.0%), an increase in driver hours (up 1.1%) and increased employee
health care costs. These increases were partially offset by reductions in indirect operating costs of $79 million in 2012, largely
due to a decrease in the expense for management incentive awards.
Cost increases have been moderated as we adjust our air and ground networks to better match higher volume levels, and
utilize technology to increase package sorting efficiency. Improved delivery densities, particularly for our residential products,
have also contained increases in cost. These network improvements allowed us to process the 3.6% volume growth more
efficiently. Some of the primary drivers of expense increased at a slower rate than the growth in volume, including average
daily direct labor hours (up 1.1%), aircraft block hours (up 0.5%) and miles driven (up 1.3%), resulting in the total cost per
piece increasing only 0.3%.
2011 compared to 2010
Overall adjusted operating expenses for the segment increased $975 million in 2011 compared with 2010, while the total
adjusted cost per piece increased 2.3% for the year. A large component of this increase related to the cost of operating our
domestic integrated air and ground network, which increased $579 million in 2011 largely due to higher fuel costs, as well as
an increase in aircraft repair and maintenance expenses and higher rates passed to us from outside transportation carriers,
primarily railroads. Pickup and delivery costs increased $354 million in 2011 compared to 2010, primarily as a result of higher
fuel prices and a 3.1% union contractual driver wage increase.
Cost increases were mitigated due to network efficiencies that we achieved, as we adjusted our air and ground networks
to better match volume levels, and continued to utilize our expanded Worldport facility to operate larger aircraft and to increase
package sorting efficiency. These network efficiency improvements resulted in a 0.8% reduction in total labor hours and a 0.8%
reduction in miles driven in 2011 compared with 2010. Increased delivery densities as a result of improved planning and
technology, and growth in our SurePost product, also contained increases in cost.
Operating Profit and Margin
2012 compared to 2011
The increase in adjusted operating profit in 2012 compared with 2011 was largely due to the revenue growth and the
achievement of significant operating leverage, but partially offset by the impact of having two less operating days during 2012.
Overall volume growth allowed us to better leverage our transportation network, resulting in productivity improvements and
better pick-up and delivery density, which favorably impacted our operating margins; however, these trends were somewhat
offset by changes in customer and product mix, which combined to adversely affect our revenue per piece. Additionally,
Hurricane Sandy negatively impacted operating profit by approximately $75 million in 2012.
These factors drove a 40 basis point increase in our adjusted operating margin in 2012, compared with 2011, resulting in
the 6.4% increase in adjusted operating profit.
2011 compared to 2010
Higher adjusted operating profit during 2011 compared with 2010 was driven by the increased network efficiencies,
combined with large improvements in revenue per piece and a small increase in volume. Fourth quarter 2011 adjusted operating
profit was particularly strong, with adjusted operating margins of 15.2% in comparison to 12.6% in the fourth quarter of 2010.
Significant volume growth in the business-to-consumer sector, along with cost control efforts and network efficiencies, were
the primary factors for the fourth quarter 2011 performance.