UPS 2012 Annual Report Download - page 103
Download and view the complete annual report
Please find page 103 of the 2012 UPS annual report below. You can navigate through the pages in the report by either clicking on the pages listed below, or by using the keyword search tool below to find specific information within the annual report.-
 1
1 -
2
-
3
-
4
-
5
-
6
-
7
-
8
-
9
-
10
-
11
-
12
-
13
-
14
-
15
-
16
-
17
-
18
-
19
-
20
-
21
-
22
-
23
-
24
-
25
-
26
-
27
-
28
-
29
-
30
-
31
-
32
-
33
-
34
-
35
-
36
-
37
-
38
-
39
-
40
-
41
-
42
-
43
-
44
-
45
-
46
-
47
-
48
-
49
-
50
-
51
-
52
-
53
-
54
-
55
-
56
-
57
-
58
-
59
-
60
-
61
-
62
-
63
-
64
-
65
-
66
-
67
-
68
-
69
-
70
-
71
-
72
-
73
-
74
-
75
-
76
-
77
-
78
-
79
-
80
-
81
-
82
-
83
-
84
-
85
-
86
-
87
-
88
-
89
-
90
-
91
-
92
-
 93
93 -
 94
94 -
 95
95 -
 96
96 -
 97
97 -
 98
98 -
 99
99 -
 100
100 -
 101
101 -
 102
102 -
 103
103 -
 104
104 -
 105
105 -
 106
106 -
 107
107 -
 108
108 -
 109
109 -
 110
110 -
 111
111 -
 112
112 -
 113
113 -
114
-
115
-
116
-
117
-
118
-
119
-
120
-
121
-
122
-
123
-
124
-
125
-
126
-
127
 |
 |

UNITED PARCEL SERVICE, INC. AND SUBSIDIARIES
NOTES TO CONSOLIDATED FINANCIAL STATEMENTS
91
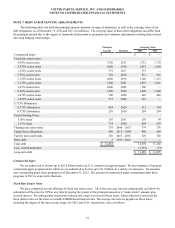
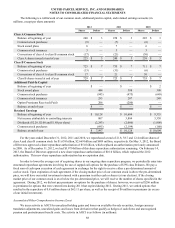
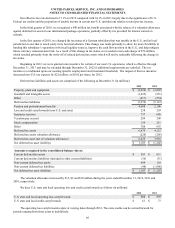
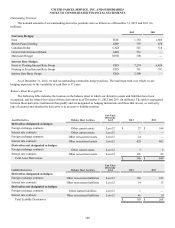
As of December 31, 2012, we had the following Restricted Units outstanding, including reinvested dividends:
Shares
(in thousands)
Weighted
Average
Grant Date
Fair Value
Weighted Average Remaining
Contractual Term
(in years)
Aggregate Intrinsic
Value (in millions)
Nonvested at January 1, 2012 15,839 $ 62.98
Vested (8,914) 63.99
Granted 7,423 77.21
Reinvested Dividends 568 N/A
Forfeited / Expired (272) 67.51
Nonvested at December 31, 2012 14,644 $ 68.71 1.57 $ 1,080
Restricted Units Expected to Vest 14,172 $ 68.61 1.55 $ 1,045
The fair value of each Restricted Unit is the NYSE closing price of class B common stock on the date of grant. The
weighted-average grant date fair value of Restricted Units granted during 2012, 2011 and 2010 was $77.21, $69.53 and $66.36,
respectively. The total fair value of Restricted Units vested was $627, $557 and $523 million in 2012, 2011 and 2010,
respectively. As of December 31, 2012, there was $571 million of total unrecognized compensation cost related to nonvested
Restricted Units. That cost is expected to be recognized over a weighted average period of 3 years and 1 month.
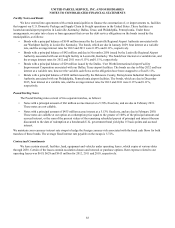
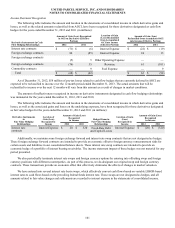
Nonqualified Stock Options
We maintain fixed stock option plans, under which options are granted to purchase shares of UPS class A common stock.
Stock options granted in connection with the Incentive Compensation Plan must have an exercise price at least equal to the
NYSE closing price of UPS class B common stock on the date the option is granted.
Executive officers and certain senior managers annually receive non-qualified stock options of which the value is
determined as a percentage of salary. Options granted generally vest over a five year period with approximately 20% of the
award vesting at each anniversary date of the grant. All options granted are subject to earlier cancellation or vesting under
certain conditions. Option holders may exercise their options via the tender of cash or class A common stock, and new class A
shares are issued upon exercise. Options granted to eligible employees will be granted annually during the first quarter of each
year.
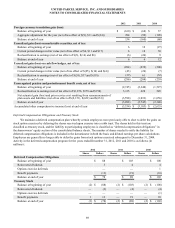
The following is an analysis of options to purchase shares of class A common stock issued and outstanding:
Shares
(in thousands)
Weighted
Average
Exercise
Price
Weighted Average Remaining
Contractual Term
(in years)
Aggregate Intrinsic
Value (in millions)
Outstanding at January 1, 2012 13,199 $ 70.18
Exercised (2,778) 63.50
Granted 187 76.94
Forfeited / Expired (13) 82.74
Outstanding at December 31, 2012 10,595 $ 72.04 3.03 $ 34
Options Vested and Expected to Vest 10,595 $ 72.04 3.03 $ 34
Exercisable at December 31, 2012 10,115 $ 72.09 2.79 $ 32
The fair value of each option grant is estimated using the Black-Scholes option pricing model. The weighted average
assumptions used, by year, and the calculated weighted average fair values of options, are as follows:
2012 2011 2010
Expected dividend yield 2.77% 2.77% 2.70%
Risk-free interest rate 1.63% 2.90% 3.30%
Expected life in years 7.5 7.5 7.5
Expected volatility 25.06% 24.26% 23.59%
Weighted average fair value of options granted $ 14.88 $ 15.92 $ 14.83