UPS 2012 Annual Report Download - page 83
Download and view the complete annual report
Please find page 83 of the 2012 UPS annual report below. You can navigate through the pages in the report by either clicking on the pages listed below, or by using the keyword search tool below to find specific information within the annual report.-
 1
1 -
2
-
3
-
4
-
5
-
6
-
7
-
8
-
9
-
10
-
11
-
12
-
13
-
14
-
15
-
16
-
17
-
18
-
19
-
20
-
21
-
22
-
23
-
24
-
25
-
26
-
27
-
28
-
29
-
30
-
31
-
32
-
33
-
34
-
35
-
36
-
37
-
38
-
39
-
40
-
41
-
42
-
43
-
44
-
45
-
46
-
47
-
48
-
49
-
50
-
51
-
52
-
53
-
54
-
55
-
56
-
57
-
58
-
59
-
60
-
61
-
62
-
63
-
64
-
65
-
66
-
67
-
68
-
69
-
70
-
71
-
72
-
 73
73 -
 74
74 -
 75
75 -
 76
76 -
 77
77 -
 78
78 -
 79
79 -
 80
80 -
 81
81 -
 82
82 -
 83
83 -
 84
84 -
 85
85 -
 86
86 -
 87
87 -
 88
88 -
 89
89 -
 90
90 -
 91
91 -
 92
92 -
 93
93 -
94
-
95
-
96
-
97
-
98
-
99
-
100
-
101
-
102
-
103
-
104
-
105
-
106
-
107
-
108
-
109
-
110
-
111
-
112
-
113
-
114
-
115
-
116
-
117
-
118
-
119
-
120
-
121
-
122
-
123
-
124
-
125
-
126
-
127
 |
 |

UNITED PARCEL SERVICE, INC. AND SUBSIDIARIES
NOTES TO CONSOLIDATED FINANCIAL STATEMENTS
71
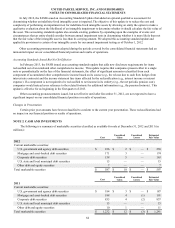
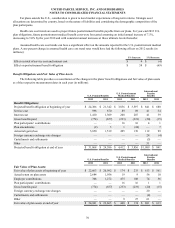
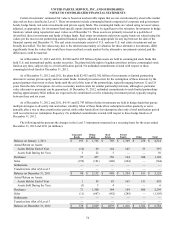
Funded Status
The following table discloses the funded status of our plans and the amounts recognized in our balance sheet as of
December 31 (in millions):
U.S. Pension Benefits
U.S. Postretirement
Medical Benefits
International
Pension
Benefits
2012 2011 2012 2011 2012 2011
Funded Status:
Fair value of plan assets $ 24,941 $ 22,663 $ 460 $ 174 $ 801 $ 613
Benefit obligation (31,868)(24,386)(4,412)(3,836)(1,089)(841)
Funded status recognized at December 31 $(6,927) $ (1,723) $ (3,952) $ (3,662) $ (288) $ (228)
Funded Status Amounts Recognized in our Balance
Sheet:
Other non-current assets $ — $ — $ — $ — $ 26 $ 1
Other current liabilities (14)(13)(108)(93)(3)(3)
Pension and postretirement benefit obligations (6,913)(1,710)(3,844)(3,569)(311)(226)
Net liability at December 31 $(6,927) $ (1,723) $ (3,952) $ (3,662) $ (288) $ (228)
Amounts Recognized in AOCI:
Unrecognized net prior service cost $(1,318) $ (1,492) $ (79) $ (82) $ (13) $ (14)
Unrecognized net actuarial loss (3,187)(2,439)(441)(307)(86)(52)
Gross unrecognized cost at December 31 (4,505)(3,931)(520)(389)(99)(66)
Deferred tax asset at December 31 1,694 1,479 196 146 26 16
Net unrecognized cost at December 31 $(2,811) $ (2,452) $ (324) $ (243) $ (73) $ (50)
The accumulated benefit obligation for our pension plans as of the measurement dates in 2012 and 2011 was $30.350 and
$23.307 billion, respectively.
Benefit payments under the pension plans include $16 and $14 million paid from employer assets in both 2012 and 2011.
Benefit payments (net of participant contributions) under the postretirement medical benefit plans include $110 and $108
million paid from employer assets in 2012 and 2011, respectively. Such benefit payments from employer assets are also
categorized as employer contributions.
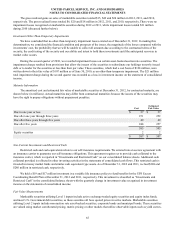
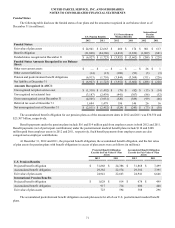
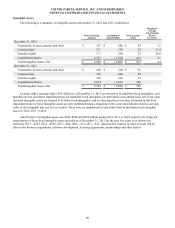
At December 31, 2012 and 2011, the projected benefit obligation, the accumulated benefit obligation, and the fair value
of plan assets for pension plans with benefit obligations in excess of plan assets were as follows (in millions):
Projected Benefit Obligation
Exceeds the Fair Value of Plan
Assets
Accumulated Benefit Obligation
Exceeds the Fair Value of Plan
Assets
2012 2011 2012 2011
U.S. Pension Benefits
Projected benefit obligation $ 31,868 $ 24,386 $ 31,868 $ 7,499
Accumulated benefit obligation 29,382 22,574 29,382 7,395
Fair value of plan assets 24,941 22,663 24,941 6,646
International Pension Benefits
Projected benefit obligation $ 1,028 $ 814 $ 678 $ 499
Accumulated benefit obligation 917 714 606 448
Fair value of plan assets 723 594 388 296
The accumulated postretirement benefit obligation exceeds plan assets for all of our U.S. postretirement medical benefit
plans.